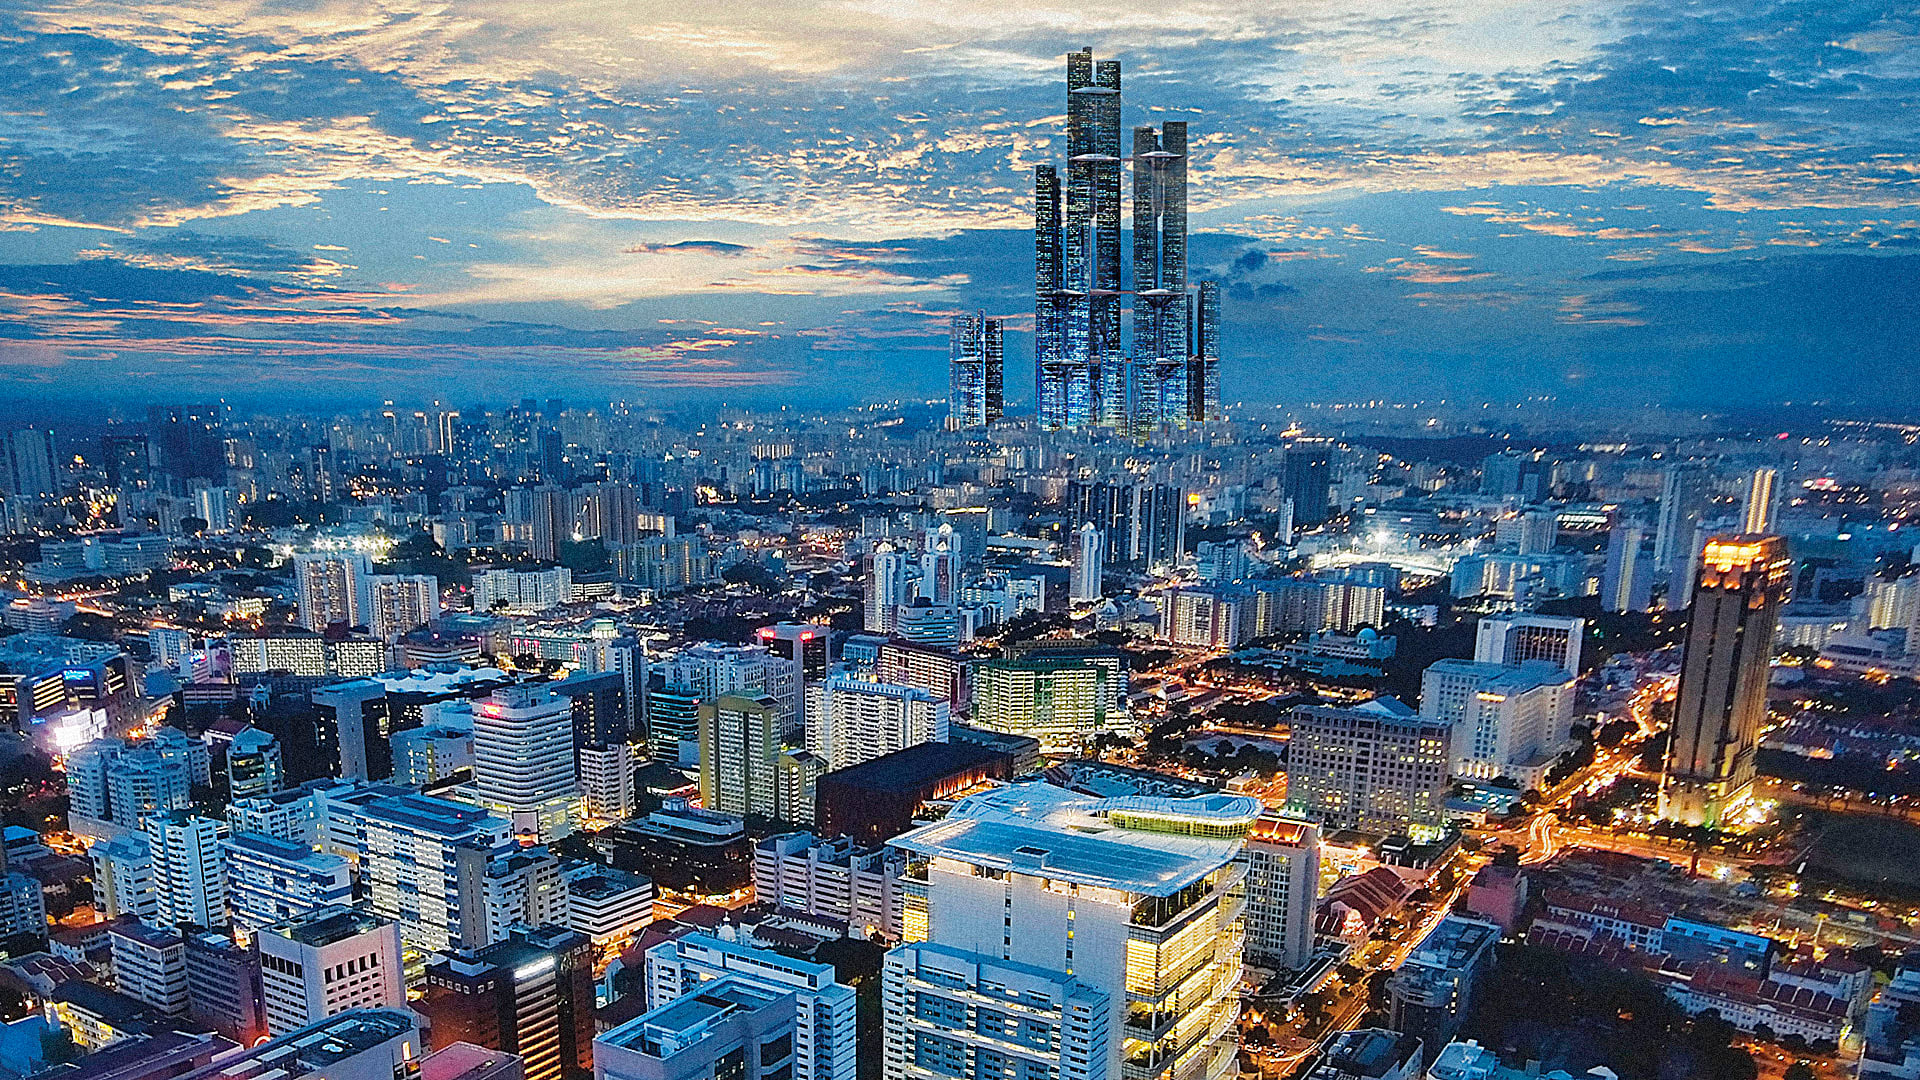
Some people think “vertical” city is the best, where people live and work in tall buildings. Others think “horizontal” city is better, where there are few tall buildings. Discuss both these views and give your own opinion. Sample Answer It is often argued that upward urban development is the optimal planning strategy, where skyscrapers redefine […]
Writing Task 2