
The bar graph shows the total manufacturing production in percentages in Asia, Europe, and the rest of the world.
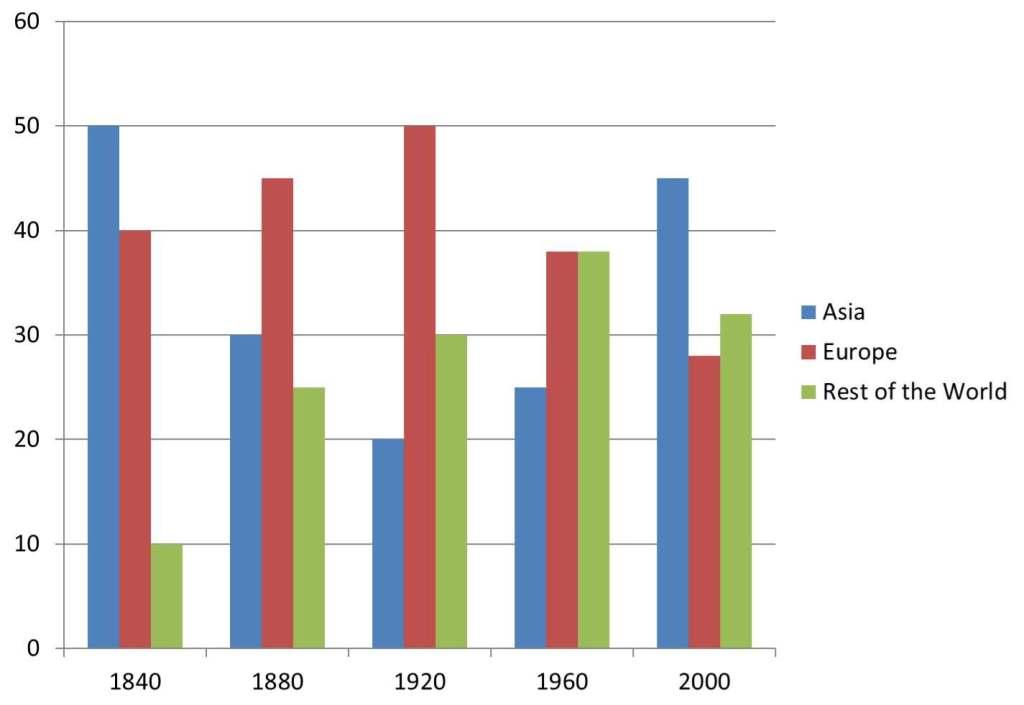
The bar chart illustrates the manufacturing production numbers, expressed as percentages, in Asia, Europe, and the remaining areas of the world.
Overall, Asia and Europe’s production decreased while that of the other regions increased noticeably at the end of the period. By 2000, Asia remained prominent in terms of production statistics, though the rest of the world had seen increases, overtaking Europe to become the second largest area in terms of manufacturing.
Asia began the period registering 50% of the global total production, compared to a slightly lower 40% in Europe. While Asia’s percentage declined significantly and consistently to 30% in 1880 and then 20% in 1920, Europe’s number rose, though more moderately, to 50% in 1920. Then, the two areas continued to display reverse trends as Europe declined gradually to less than 30%, whereas there was a substantial growth in Asia’s production figure to roughly 45% in 2000.
In 1840, 10% of the world’s manufacturing production came from the rest of the world. This category grew steadily and markedly by approximately 5% every 40 years, eventually equaling Europe at just below 40% in 1960, before declining to end the timeline at over 30%, overtaking Europe and coming in second place to Asia.
Essay breakdown
Structure
Introduction:
[1] The bar chart illustrates the manufacturing production numbers, expressed as percentages, in Asia, Europe, and the remaining areas of the world.
[2] Overall, Asia and Europe’s production decreased while that of the other regions increased noticeably at the end of the period. [3] By 2000, Asia remained prominent in terms of production statistics, though the rest of the world had seen increases, overtaking Europe to become the second largest area in terms of manufacturing.
1. Write a general statement to introduce the topic of the bar chart and its content.
- Write a clear overview to summarise the main features of the bar chart, highlighting the overall trends.
- Highlights and compares prominent data in the chart.
Body 1:
[1] Asia began the period registering 50% of the global total production, compared to a slightly lower 40% in Europe. [2] While Asia’s percentage declined significantly and consistently to 30% in 1880 and then 20% in 1920, Europe’s number rose, though more moderately, to 50% in 1920. [3] Then, the two areas continued to display reverse trends as Europe declined gradually to less than 30%, whereas there was a substantial growth in Asia’s production figure to roughly 45% in 2000.
- Describe the trend of Asia with a comparison to Europe.
- Continue to describe Asia and Europe together
- Combine two categories, describing them together until the end of the timeline.
Body 2:
[1] In 1840, 10% of the world’s manufacturing production came from the rest of the world. [2] This category grew steadily and markedly by approximately 5% every 40 years, eventually equaling Europe at just below 40% in 1960, before declining to end the timeline at over 30%, overtaking Europe and coming in second place to Asia.
- Describe the trend of “the rest of the world”
- Continue to describe this category, comparing it with other areas.
Vocabulary
The bar chart illustrates the manufacturing production numbers, expressed as percentages, in Asia, Europe, and the remaining areas of the world.
Overall, Asia and Europe’s production decreased while that of the other regions increased noticeably at the end of the period. By 2000, Asia remained prominent in terms of production statistics, though the rest of the world had seen increases, overtaking Europe to become the second largest area in terms of manufacturing.
Asia began the period registering 50% of the global total production, compared to a slightly lower 40% in Europe. While Asia’s percentage declined significantly and consistently to 30% in 1880 and then 20% in 1920, Europe’s number rose, though more moderately, to 50% in 1920. Then, the two areas continued to display reverse trends as Europe declined gradually to less than 30%, whereas there was a substantial growth in Asia’s production figure to roughly 45% in 2000.
In 1840, 10% of the world’s manufacturing production came from the rest of the world. This category grew steadily and markedly by approximately 5% every 40 years, eventually equaling Europe at just below 40% in 1960, before declining to end the timeline at over 30%, overtaking Europe and coming in second place to Asia.
Vocabulary Highlight:
- The bar chart illustrates manufacturing production numbers: a graphical representation of the production figures
- Asia and Europe’s production decreased while the rest of the world’s increased noticeably: there was a decline in production for Asia and Europe, while the other regions saw an increase
- Asia registered 50% of global total production at the beginning of the period: Asia had the highest percentage of production at the start of the period
- Europe’s number rose, though more moderately: Europe’s production increased at a slower rate compared to Asia
- Europe’s production declined gradually to less than 30%: Europe’s production figure decreased over time and ended up below 30%
- Asia’s production figure grew substantially to roughly 45% in 2000: Asia’s production figure increased significantly and reached about 45% by the year 2000
- The rest of the world’s manufacturing production grew steadily and markedly: the production figure for the remaining regions grew at a steady and noticeable rate
- The rest of the world eventually equalled Europe at just below 40% in 1960: the production figure for the remaining regions eventually reached a similar level to Europe, just below 40% in 1960
- The rest of the world overtook Europe and became the second-largest area in terms of manufacturing: the remaining regions surpassed Europe and became the second-largest area for manufacturing production.
Grammar Gems
COMPARATIVE AND SUPERLATIVE ADJECTIVES
“Asia remained prominent in terms of production statistics, though the rest of the world had seen increases, overtaking Europe to become the second largest area in terms of manufacturing.”
Here, “prominent” is a comparative adjective comparing Asia to the other regions in terms of production, while “second largest” is a superlative adjective describing the rest of the world’s position in manufacturing. This use of comparative and superlative adjectives is important in understanding the relative positions of the different regions in terms of manufacturing production.
Reading
Further reading about this topic can be found here:
https://economics.rabobank.com/publications/2016/february/asia-pacific-agricultural-perspectives/
Listening
Further listening about this topic can be found here: