

Poverty Rates
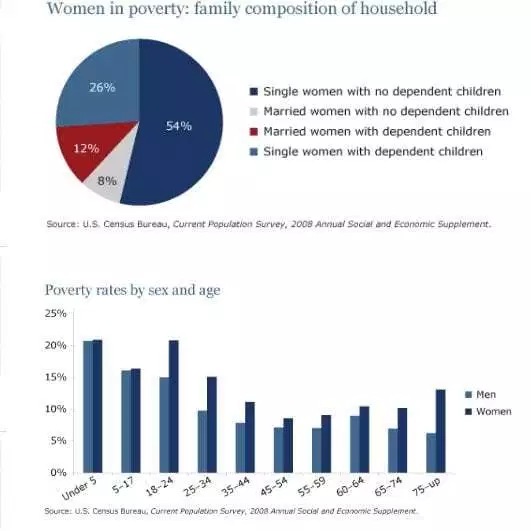
The pie chart shows women in poverty in the United States and the bar chart compares poverty rates by gender.
The pie chart demonstrates the poverty situation of females, whereas the bar chart compares poverty levels across genders.
Overall, single women, especially those without dependent offspring, had the highest levels of poverty. In contrast, married women generally experienced lower poverty rates, however, those with dependent children registered a higher incidence. Additionally, poverty affected men less frequently than women, and both genders experienced poverty more commonly in their younger years.
Regarding the pie chart, over half (54%) of single women living in poverty do not have dependent children, while only 26% have dependent offspring. Married women with children accounted for only 12% of the total, and those without children comprised just 8%.
The bar chart indicates that poverty rates generally decreased as both genders age. Men and women displayed similar rates for most age groups, although there are some exceptions. For instance, among the 18-24, women had a higher poverty rate, at over 20% compared to around 15% for men. A similar pattern is observed in the 25-34 age bracket (10% for men and over 15% for women), although it is less pronounced in the 35-44 age group (7% for males and 12% for females). Finally, in the 75+ age group, women living below the poverty line were more than double their male counterparts, at nearly 15% compared to just over 5%.
(221 words)
Essay breakdown
Introduction:
[1] The pie chart demonstrates the poverty situation of females, whereas the bar chart compares poverty levels across genders.
[2] Overall, single women, especially those without dependent offspring, had the highest levels of poverty. [3] In contrast, married women generally experienced lower poverty rates, however, those with dependent children registered a higher incidence. [4] Additionally, poverty affected men less frequently than women, and both genders experienced poverty more commonly in their younger years.
- Write a general statement to introduce the topic
- Single women (pie chart)
- Married women (pie chart)
- Compare men and women (bar chart)
Body 1:
[1] Regarding the pie chart, over half (54%) of single women living in poverty do not have dependent children, while only 26% have dependent offspring. [2] Married women with children accounted for only 12% of the total, and those without children comprised just 8%.
- Details of single women
- Details of married women
Body 2:
The bar chart indicates that poverty rates generally decreased as both genders age. Men and women displayed similar rates for most age groups, although there are some exceptions. For instance, among the 18-24, women had a higher poverty rate, at over 20% compared to around 15% for men. A similar pattern is observed in the 25-34 age bracket (10% for men and over 15% for women), although it is less pronounced in the 35-44 age group (7% for males and 12% for females). Finally, in the 75+ age group, women living below the poverty line were more than double their male counterparts, at nearly 15% compared to just over 5%.
- Summarise the trend of the bar chart
- The most prominent feature of the pie chart
- Typical feature(s): The 18-24
- Typical feature(s): The 25-34 and 35-44
- Typical feature(s): The 75+
Vocabulary:
The pie chart demonstrates the poverty situation of females, whereas the bar chart compares poverty levels across genders.
Overall, single women, especially those without dependent offspring, had the highest levels of poverty. In contrast, married women generally experienced lower poverty rates, however, those with dependent children registered a higher incidence. Additionally, poverty affected men less frequently than women, and both genders experienced poverty more commonly in their younger years.
Regarding the pie chart, over half (54%) of single women living in poverty do not have dependent children, while only 26% have dependent offspring. Married women with children accounted for only 12% of the total, and those without children comprised just 8%.
The bar chart indicates that poverty rates generally decreased as both genders age. Men and women displayed similar rates for most age groups, although there are some exceptions. For instance, among the 18-24, women had a higher poverty rate, at over 20% compared to around 15% for men. A similar pattern is observed in the 25-34 age bracket (10% for men and over 15% for women), although it is less pronounced in the 35-44 age group (7% for males and 12% for females). Finally, in the 75+ age group, women living below the poverty line were more than double their male counterparts, at nearly 15% compared to just over 5%.
Vocabulary Highlights:
- Poverty situation: state of being poor or lacking basic resources
- Incidence: frequency or occurrence of something
- Dependent offspring: children who rely on parents/guardians for support
- Poverty rates: percentage of people living below the poverty line
- Gender: social and cultural roles associated with being male/female
- Younger years: early stages of life before middle age
- Pie chart: graph showing proportions of categories in a circle
- Bar chart: graph using bars to compare quantities across categories
- Single women: unmarried women
- Married women: legally married women
- Poverty line: minimum income/resources needed for basic needs
- Age groups: categories of people based on age
- Poverty levels: extent or degree of poverty experienced
- Higher poverty rates: greater proportion living below the poverty line
- Lower poverty rates: smaller proportion living below the poverty line
Diamond Grammar:
COMPLEX SENTENCE STRUCTURE
“Regarding the pie chart, over half (54%) of single women living in poverty do not have dependent children, while only 26% have dependent offspring”
The clause “while only 26% have dependent offspring” provides additional information about the poverty situation of single women with dependent children.
Reading:
Further reading about this topic can be found here:
Listening:
Further listening about this topic can be found here:
