

TASK 1 (MAPS): FRUITS AND VEGETABLES
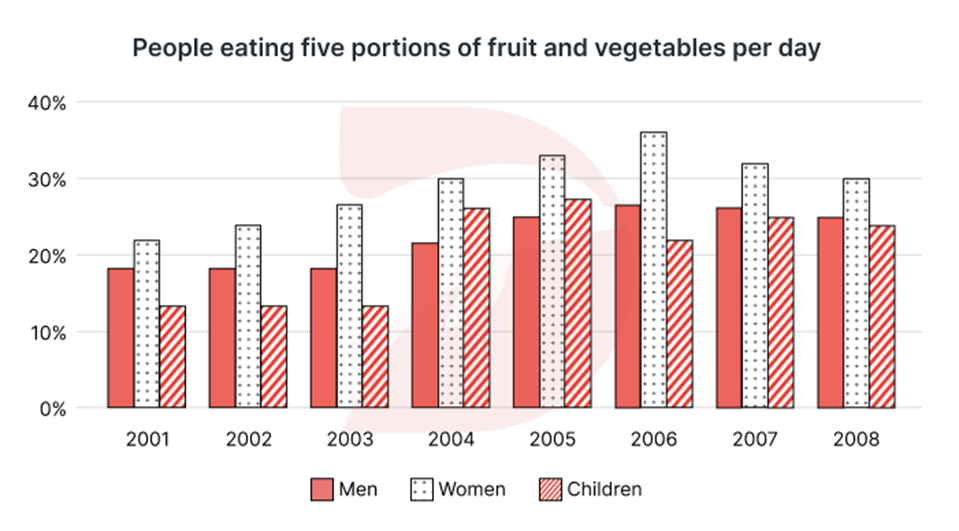
The chart below shows the percentage of people who ate five portions of fruits and vegetables per day in the UK from 2001 to 2008.
Sample answer (Viết canh giờ 20 phút)
The provided bar chart illustrates data regarding the proportions of individuals who consumed five portions of fruits and vegetables, categorised into three distinct groups.
Overall, women consistently showed the highest level of commitment to the provided dietary guidelines throughout and their participation increased over the period. Meanwhile, males and children also experienced increases in their adherence, with the latter surpassing the former only in two years: 2004 and 2005.
In 2001, women following this dietary choice accounted for over 20% of the total, making this group the most prominent, slightly ahead of men, with the figure standing at around 18%. Children eating the suggested portions trailed behind, registering approximately 12%.
In the ensuing years, the proportion of women rose steadily, followed by a peak of roughly 35% in 2006 before a gradual decline to end the period at 30%, solidifying their dominance throughout the surveyed timeline. The figures for men, on the other hand, were largely stable until 2003, with a subsequent increase to around 26% in 2006 and 2007. Thereafter, it dropped modestly to finish the period at around 24%, maintaining its 2nd ranking. A similar pattern was seen in children, remaining relatively unchanged from 2001 to 2003, followed by a twofold increase to around 26% in 2004 and 2005, outnumbering the statistics for males. It then dropped by 3% in 2006 before recovering to around 23% in 2007 and 2008, securing its 3rd position.
Word Count: 236 words
Marking by Chat GPT Plus

Final Sample Answer:
The chart below shows the percentage of people who ate five portions of fruits and vegetables per day in the UK from 2001 to 2008.

The provided bar chart illustrates data regarding the proportions of individuals who consumed five portions of fruits and vegetables, categorized into three distinct groups.
Overall, women consistently showed the highest level of commitment to the provided dietary guidelines throughout, and their participation increased over the period. Meanwhile, men and children also experienced increases in their adherence, with the latter surpassing the former only in two years: 2004 and 2005.
In 2001, women following this dietary choice accounted for over 20% of the total, making this group the most prominent, slightly ahead of men, with the figure standing at around 18%. Children eating the suggested portions trailed behind, registering approximately 12%.
In the ensuing years, the proportion of women rose steadily, reaching a peak of 35% in 2006 before falling gradually to 30% by the end of the period, solidifying their dominance throughout the surveyed timeline. The figures for men, on the other hand, were largely stable until 2003, with a subsequent increase to around 26% in 2006 and 2007. Thereafter, the figure dropped modestly, finishing the period at around 24%, maintaining its second ranking.
A similar pattern was seen in children, remaining relatively unchanged from 2001 to 2003, followed by a significant rise to around 26% in 2004 and 2005, outnumbering the statistics for men. It then dropped by 3% in 2006 before recovering to around 23% in 2007 and 2008, securing its third position.
Vocabulary
- proportions – tỷ lệ phần trăm
- consumed five portions – tiêu thụ năm khẩu phần
- categorized into – được phân loại thành
- consistently showed the highest level of commitment – luôn thể hiện mức độ cam kết cao nhất
- provided dietary guidelines – hướng dẫn chế độ ăn được đề xuất
- increased over the period – tăng lên theo thời gian
- experienced increases in their adherence – có sự gia tăng trong mức độ tuân thủ
- surpassing the former – vượt qua nhóm trước đó
- accounted for over – chiếm hơn
- most prominent – nổi bật nhất
- standing at around – ở mức khoảng
- suggested portions – khẩu phần được đề xuất
- trailed behind – tụt lại phía sau
- registering approximately – ghi nhận xấp xỉ
- ensuing years – những năm tiếp theo
- rose steadily – tăng đều
- reaching a peak – đạt đỉnh
- falling gradually – giảm dần
- solidifying their dominance – củng cố vị thế thống trị
- largely stable – hầu như ổn định
- subsequent increase – sự gia tăng tiếp theo
- dropped modestly – giảm nhẹ
- maintaining its second ranking – duy trì vị trí thứ hai
- significant rise – sự gia tăng đáng kể
- securing its third position – đảm bảo vị trí thứ ba
TỦ NGỮ PHÁP IELTS WRITING TASK 1 – DẠNG BAR CHART (THEO NĂM)
1. Overview phải nêu được xu hướng tổng thể + so sánh vị trí đầu/cuối
- Dạng bar chart thường có thể hiện thứ hạng, nên Overview cần nêu: nhóm nào cao nhất/thấp nhất, xu hướng chính.
👉 Ví dụ:
“Overall, women consistently showed the highest level of commitment to the provided dietary guidelines throughout the period.”
2. Tense chuẩn cho dạng theo năm (trong quá khứ) là quá khứ đơn
- Luôn dùng quá khứ đơn để mô tả số liệu đã xảy ra.
👉 Ví dụ:
“The figure stood at around 18%.”
“Children trailed behind at approximately 12%.”
3. Passive voice – dùng đúng lúc, tránh lạm dụng
- Với bar chart, bị động thường dùng khi chủ thể không rõ hoặc muốn nhấn vào hành động.
👉 Ví dụ:
(Không cần bị động như “The number was increased” → dùng chủ động “the figure increased” sẽ mượt hơn)
4. Cụm “stood at / peaked at / dropped to” cực kỳ hiệu quả
- Dùng để mô tả chính xác con số kèm xu hướng.
👉 Ví dụ:
“The figure for women peaked at roughly 35% in 2006.”
“Men’s figure dropped modestly to around 24%.”
5. Từ vựng mô tả xu hướng tăng/giảm cực kỳ quan trọng
- Tăng: rose steadily, increased significantly, climbed gradually
- Giảm: dropped modestly, fell slightly, declined gradually
👉 Ví dụ:
“The proportion rose steadily until 2006.”
“It dropped by 3% before recovering in 2007.”
6. So sánh: dùng “outnumbered”, “remained ahead of”, “surpassed”
- So sánh các nhóm, đặc biệt khi có thay đổi về vị trí.
👉 Ví dụ:
“Children outnumbered men in 2004 and 2005.”
“Women remained ahead of both groups throughout.”
7. Cụm “followed by”, “meanwhile”, “on the other hand” để liên kết mượt mà hơn
- Giúp bài không bị rời rạc khi chuyển giữa nhóm hoặc năm.
👉 Ví dụ:
“Children rose to 26%, followed by a slight drop in 2006.”
“Meanwhile, men maintained second position.”
8. Cụm “ranking / position” rất hữu ích khi nói về thứ hạng
👉 Ví dụ:
“Women secured the top position throughout.”
“Men maintained their 2nd ranking until the end.”
9. “Remained relatively unchanged / stable” – diễn đạt không thay đổi
👉 Ví dụ:
“Children remained relatively unchanged from 2001 to 2003.”
10. Avoid interpretation – chỉ mô tả, không phỏng đoán
❌ “showed strong commitment” → hơi cảm tính
✅ “consistently had the highest percentage” → mô tả đúng dữ liệu
✅ TÓM TẮT NHANH CÁCH TRIỂN KHAI IDEAS CHO DẠNG BAR CHART (10 POINTS)
| STT | Cấu trúc / Collocation | Công dụng |
| 1 | Overview + xu hướng + vị trí đầu/cuối | Overview band 8.0++ |
| 2 | Quá khứ đơn (V2) | Thì bắt buộc cho số liệu quá khứ |
| 3 | Passive voice (có chọn lọc) | Nhấn vào hành động khi cần |
| 4 | Stood at / Peaked at / Dropped to | Mô tả số liệu cụ thể |
| 5 | Rose steadily / Dropped modestly | Diễn tả xu hướng chính xác |
| 6 | Outnumbered / Surpassed / Remained ahead of | So sánh nhóm rõ ràng |
| 7 | Followed by / Meanwhile / On the other hand | Kết nối giữa các mốc/năm |
| 8 | Ranking / Position | Diễn đạt thứ hạng hiệu quả |
| 9 | Remained stable / Relatively unchanged | Mô tả sự ổn định |
| 10 | Tránh diễn giải chủ quan (Avoid interpretation) | Mô tả đúng dữ kiện |
