

Age groups and cinema attendance
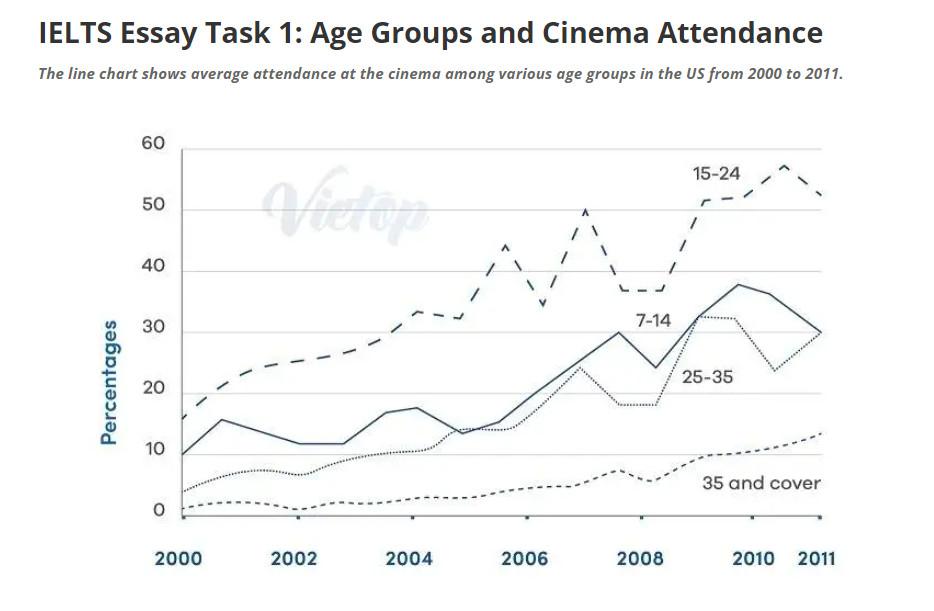
The line graph depicts the average percentages of cinema-goers at a particular cinema in terms of four different age demographics.
From an overall perspective, it is readily apparent that 15-to-24-year-olds led in all years while the 35 and over saw the lowest proportions of attendees throughout the period. Attendances in all age cohorts displayed upward trajectories, and the 7-14 and 25-35 ended the timeline at the same point despite erratic numbers.
Those from 15 to 24 were leaders among all age groups regarding attendance and witnessed an increasing trend, rising from 15% in 2000 to just over 50% in 2011 with three noticeable peaks at around 43% in 2005, 50% in 2007, and 57% mid-way through 2010. By contrast, people from 35 and over started the period close to 0%. This cohort then rose steadily to roughly 9% in 2008, dropped slightly prior to a consistent increase to end at nearly 15%.
Turning to the 7-14 and 25-35, the former started at 10%, more than double the figure for the latter. 7-to-14-year-olds rose, eventually reaching 30% in 2011 though there were a series of crests and troughs. The trajectory of the 25-35 was also characterized by erratic figures with this age group reaching a peak at over 30% in 2009, preceding a significant fall to 23% and a slight recovery to align with the 7-14 at 30% in 2011.
Essay breakdown
Introduction:
[1] The line graph depicts the average percentages of cinema-goers at a particular cinema in terms of four different age demographics.
[2] From an overall perspective, it is readily apparent that 15-to-24-year-olds led in all years while the 35 and over saw the lowest proportions of attendees throughout the period. [3] Attendances in all age cohorts displayed upward trajectories, and the 7-14 and 25-35 ended the timeline at the same point despite erratic numbers.
[1] Write a general statement to introduce the topic of the line graph and provide a general overview of the data being presented
[2] Summarise what happens in the first diagram, indicating that 15-24 year-olds had the highest attendance while 35 and over had the lowest attendance throughout the period
[3] State further details about the 7-14 and 25-35
Body 1:
[1] Those from 15 to 24 were leaders among all age groups regarding attendance and witnessed an increasing trend, rising from 15% in 2000 to just over 50% in 2011 with three noticeable peaks at around 43% in 2005, 50% in 2007, and 57% mid-way through 2010. [2] By contrast, people from 35 and over started the period close to 0%. [3] This cohort then rose steadily to roughly 9% in 2008, dropped slightly prior to a consistent increase to end at nearly 15%.
[1] Describes the attendance trend for 15-24 year-olds, including specific percentage increases and peaks in attendance
[2] Compare the attendance of the 35 and over age group to the 15-24 age group
[3] Describes the attendance trend for the 35 and over age group, including specific percentage increases and peaks in attendance
Body 2:
[1] Turning to the 7-14 and 25-35, the former started at 10%, more than double the figure for the latter. [2] 7-to-14-year-olds rose, eventually reaching 30% in 2011 though there were a series of crests and troughs. [3] The trajectory of the 25-35 was also characterized by erratic figures with this age group reaching a peak at over 30% in 2009, preceding a significant fall to 23% and a slight recovery to align with the 7-14 at 30% in 2011.
[1] Describes the attendance trend for 7-14 year-olds, including specific percentage increases and peaks/ troughs in attendance
[2] + [3] Describes the attendance trend for 25-35 year-olds, including specific percentage increases and peaks/ troughs in attendance and alignment with 7-14 year-olds at the end of the time frame.
Vocabulary:
The line graph depicts the average percentages of cinema-goers at a particular cinema in terms of four different age demographics.
From an overall perspective, it is readily apparent that 15-to-24-year-olds led in all years while the 35 and over saw the lowest proportions of attendees throughout the period. Attendances in all age cohorts displayed upward trajectories, and the 7-14 and 25-35 ended the timeline at the same point despite erratic numbers.
Those from 15 to 24 were leaders among all age groups regarding attendance and witnessed an increasing trend, rising from 15% in 2000 to just over 50% in 2011 with three noticeable peaks at around 43% in 2005, 50% in 2007, and 57% mid-way through 2010. By contrast, people from 35 and over started the period close to 0%. This cohort then rose steadily to roughly 9% in 2008, dropped slightly prior to a consistent increase to end at nearly 15%.
Turning to the 7-14 and 25-35, the former started at 10%, more than double the figure for the latter. 7-to-14-year-olds rose, eventually reaching 30% in 2011 though there were a series of crests and troughs. The trajectory of the 25-35 was also characterized by erratic figures with this age group reaching a peak at over 30% in 2009, preceding a significant fall to 23% and a slight recovery to align with the 7-14 at 30% in 2011.
- From an overall perspective: from a general point of view
- led in all years: consistently had the highest attendance
- lowest proportions: lowest percentage of attendance
- upward trajectories: an increase over time
- ended the timeline at the same point: ended at the same level
- erratic numbers: irregular or unpredictable
- leading among all age groups: having the highest attendance among all age groups
- increasing trend: a pattern of increase over time
- peaks: highest points in a trend
- by contrast: in comparison
- close to 0%: very low percentage
- steadily: consistently, at a steady rate
- dropped slightly: decreased a little
- consistent increase: steady increase
- more than double: significantly greater than
- crests and troughs: high and low points in a trend
- characterized by: known for, identified by
- erratic figures: irregular or unpredictable numbers
- significant fall: a large decrease
- slight recovery: small increase
- align with: reach the same level as
Grammar Gems:
ADVERBIAL PHRASE
“This cohort then rose steadily to roughly 9% in 2008, dropped slightly prior to a consistent increase to end at nearly 15%.”
The essay uses the phrase “prior to” which is an adverbial phrase indicating that one event happened before another.
Reading:
Further reading about this topic can be found here:
Listening:
Further listening about this topic can be found here:
