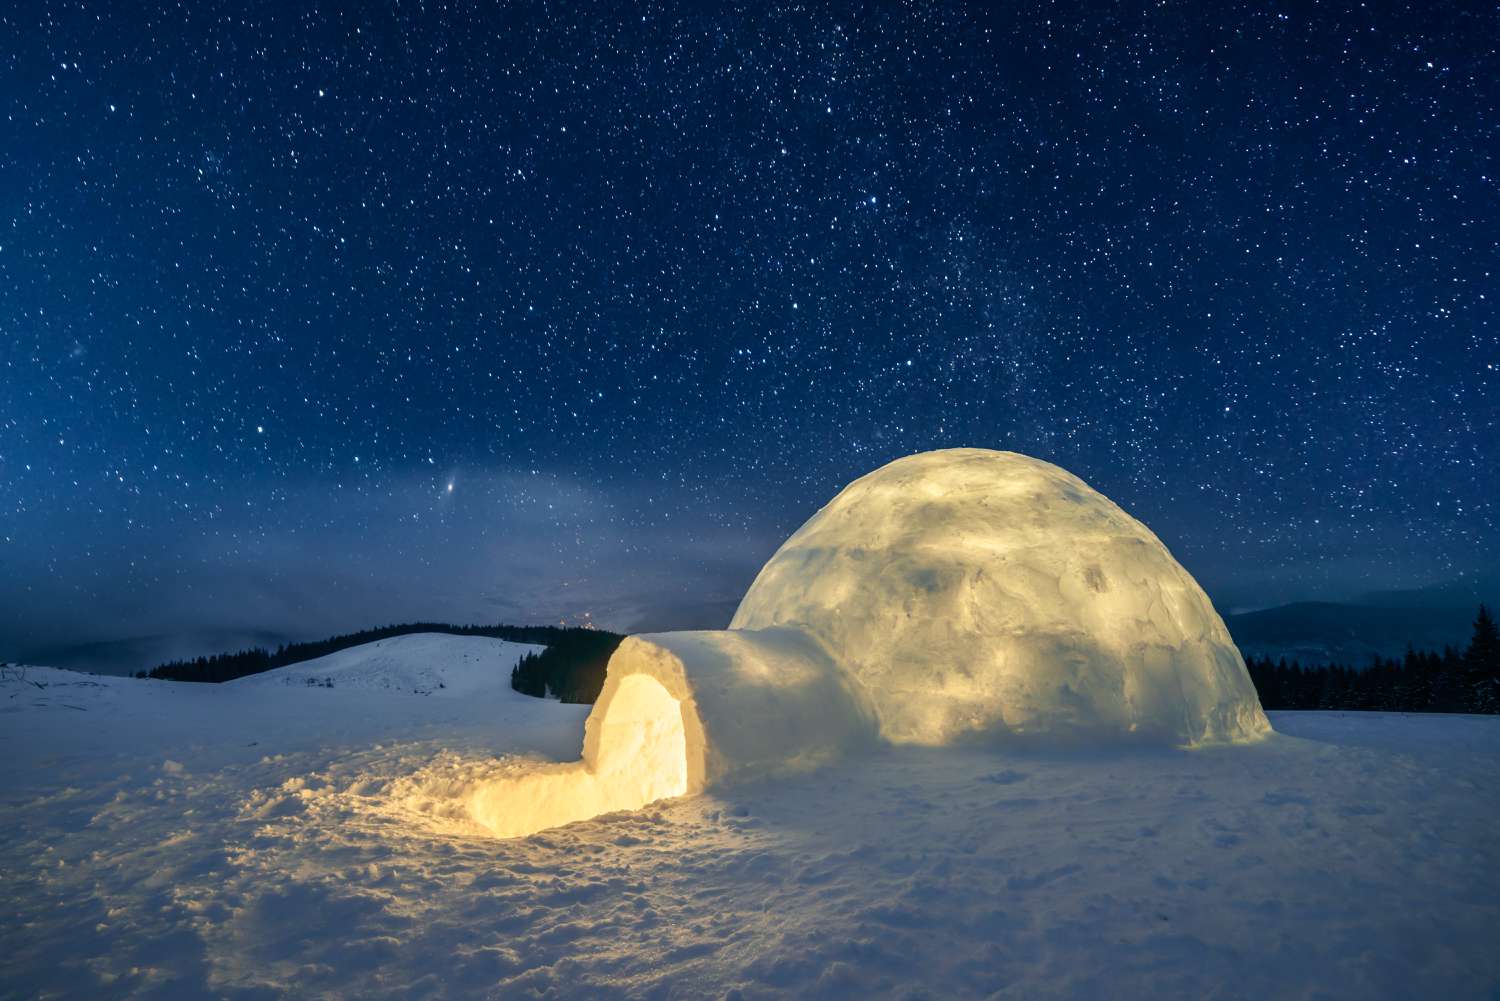
boom, eruption, forest-1292898.jpg
Writing Task 1

Volcano

The diagram provides information about the Hawaiian island chain, which is located in the centre of the Pacific Ocean.  Looking from an overall perspective, it is evident that the island chain comprises 6 major islands, with Hawaii being the largest and Niihau the smallest, while the others are of medium sizes. Additionally, there are incremental […]

children, slums, poverty-2876359.jpg
Writing Task 1

Those In Poverty

The table provides statistics on age demographics, average income per person, and the percentage of people living in impoverished conditions.  Looking from an overall perspective, it is evident that Utah, despite having the highest percentage of minors, displayed the lowest figure for elderly individuals over 60, while Florida showed the most 60+ people. Additionally, California […]

poverty, black and white, emotion-4561704.jpg
Writing Task 1

Poverty Rates

The pie chart shows women in poverty in the United States and the bar chart compares poverty rates by gender. The pie chart demonstrates the poverty situation of females, whereas the bar chart compares poverty levels across genders. Overall, single women, especially those without dependent offspring, had the highest levels of poverty. In contrast, married […]

remote, work, office-5491798.jpg
Writing Task 1

Number of Jobs

The line graph delineates past changes in the employment patterns in three different industries in America and future predictions, in millions.  Overall, employment statistics in the agrarian sector decreased and will likely continue a downward trend, services have seen an increase and are expected to maintain a rise, and the rate of employment in the […]

Call Now Button