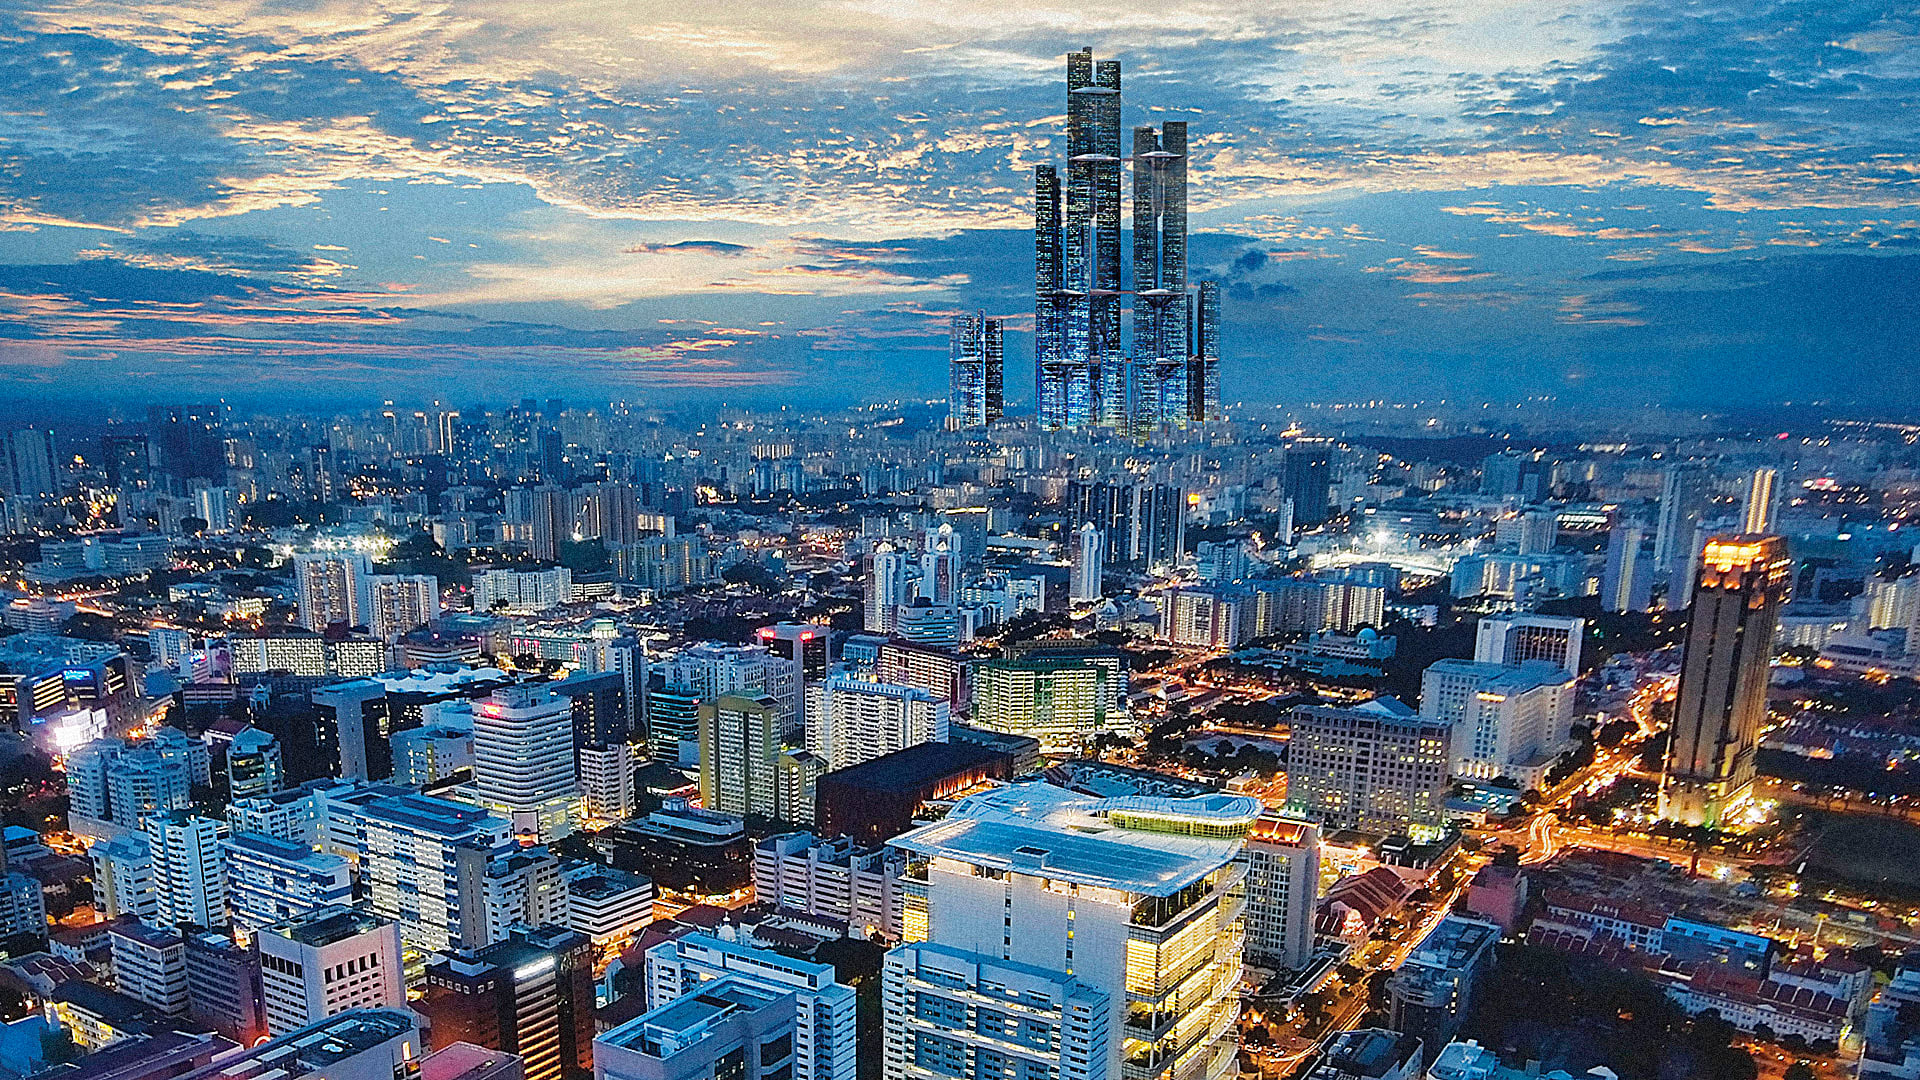
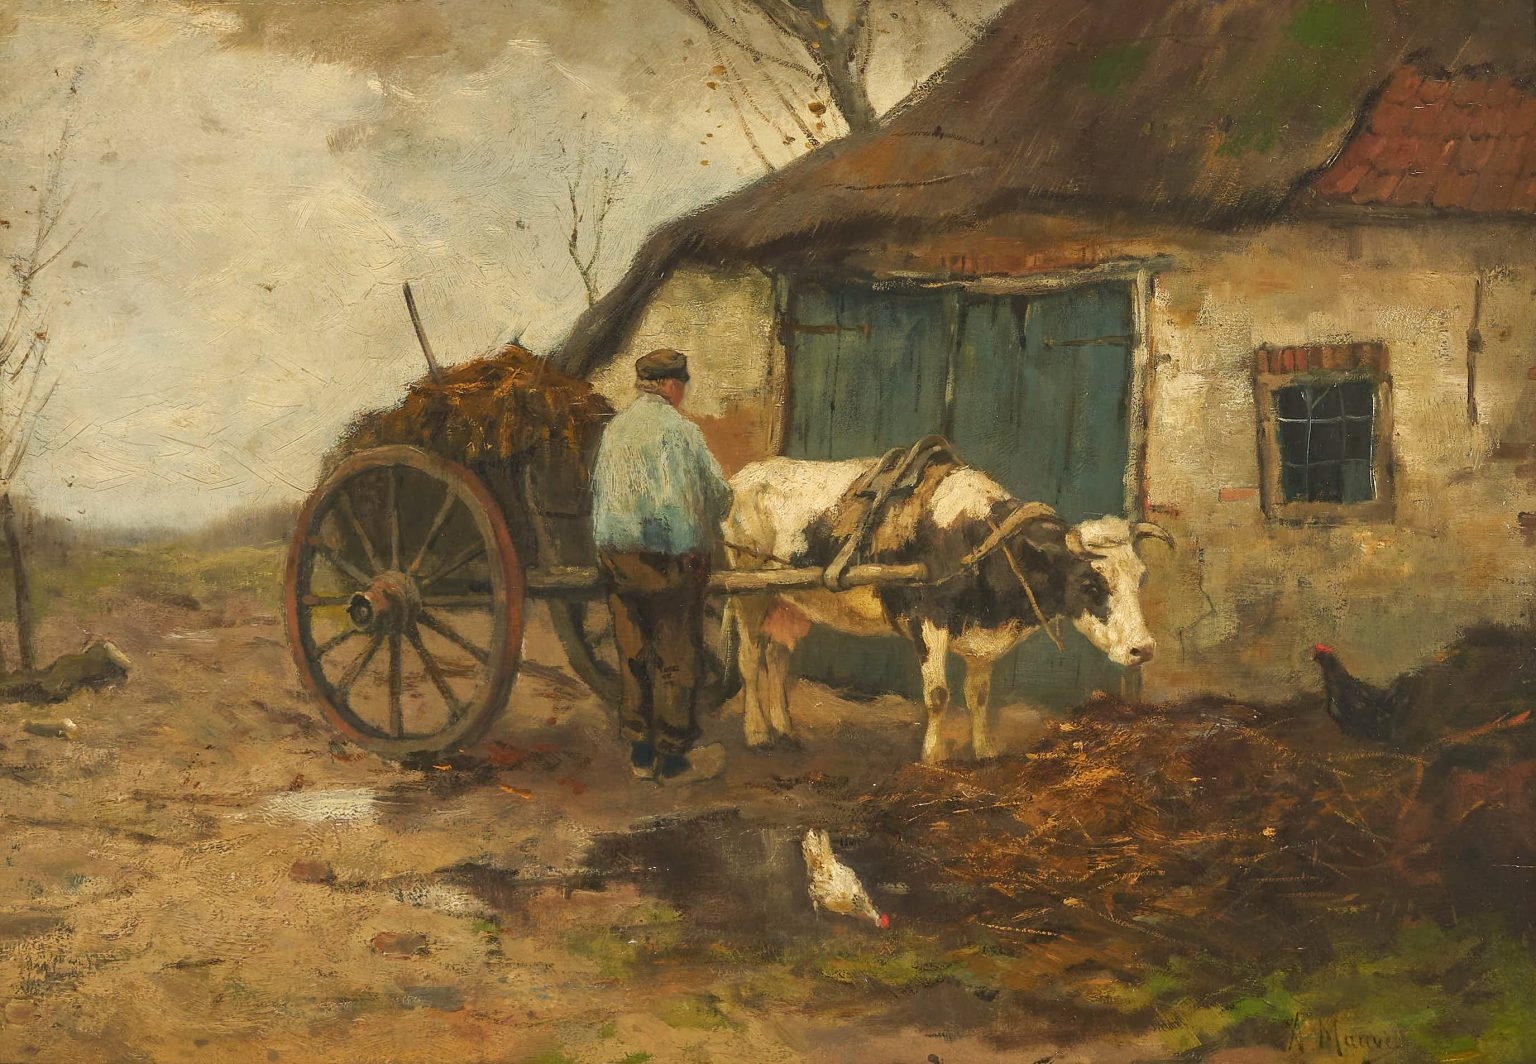
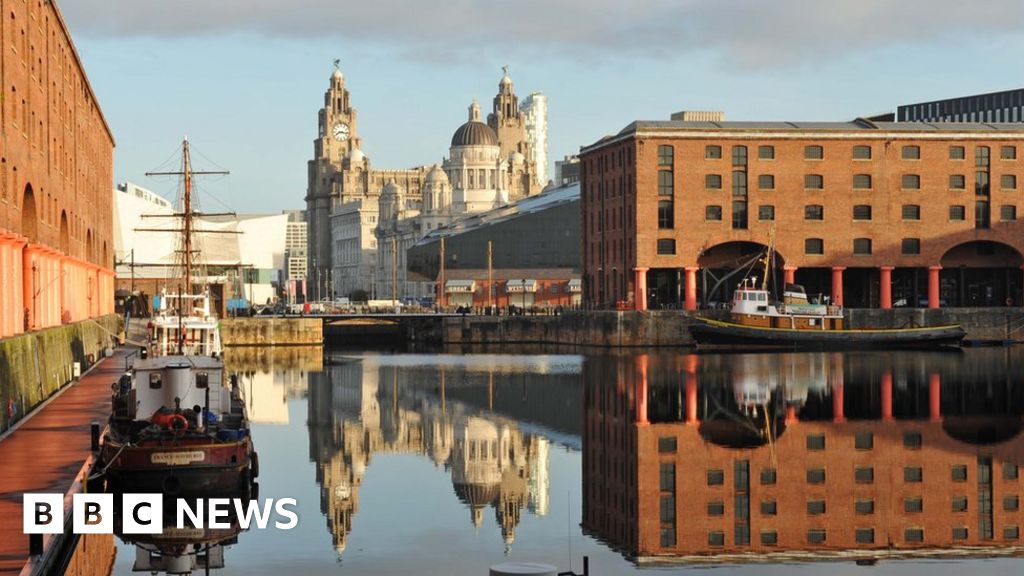
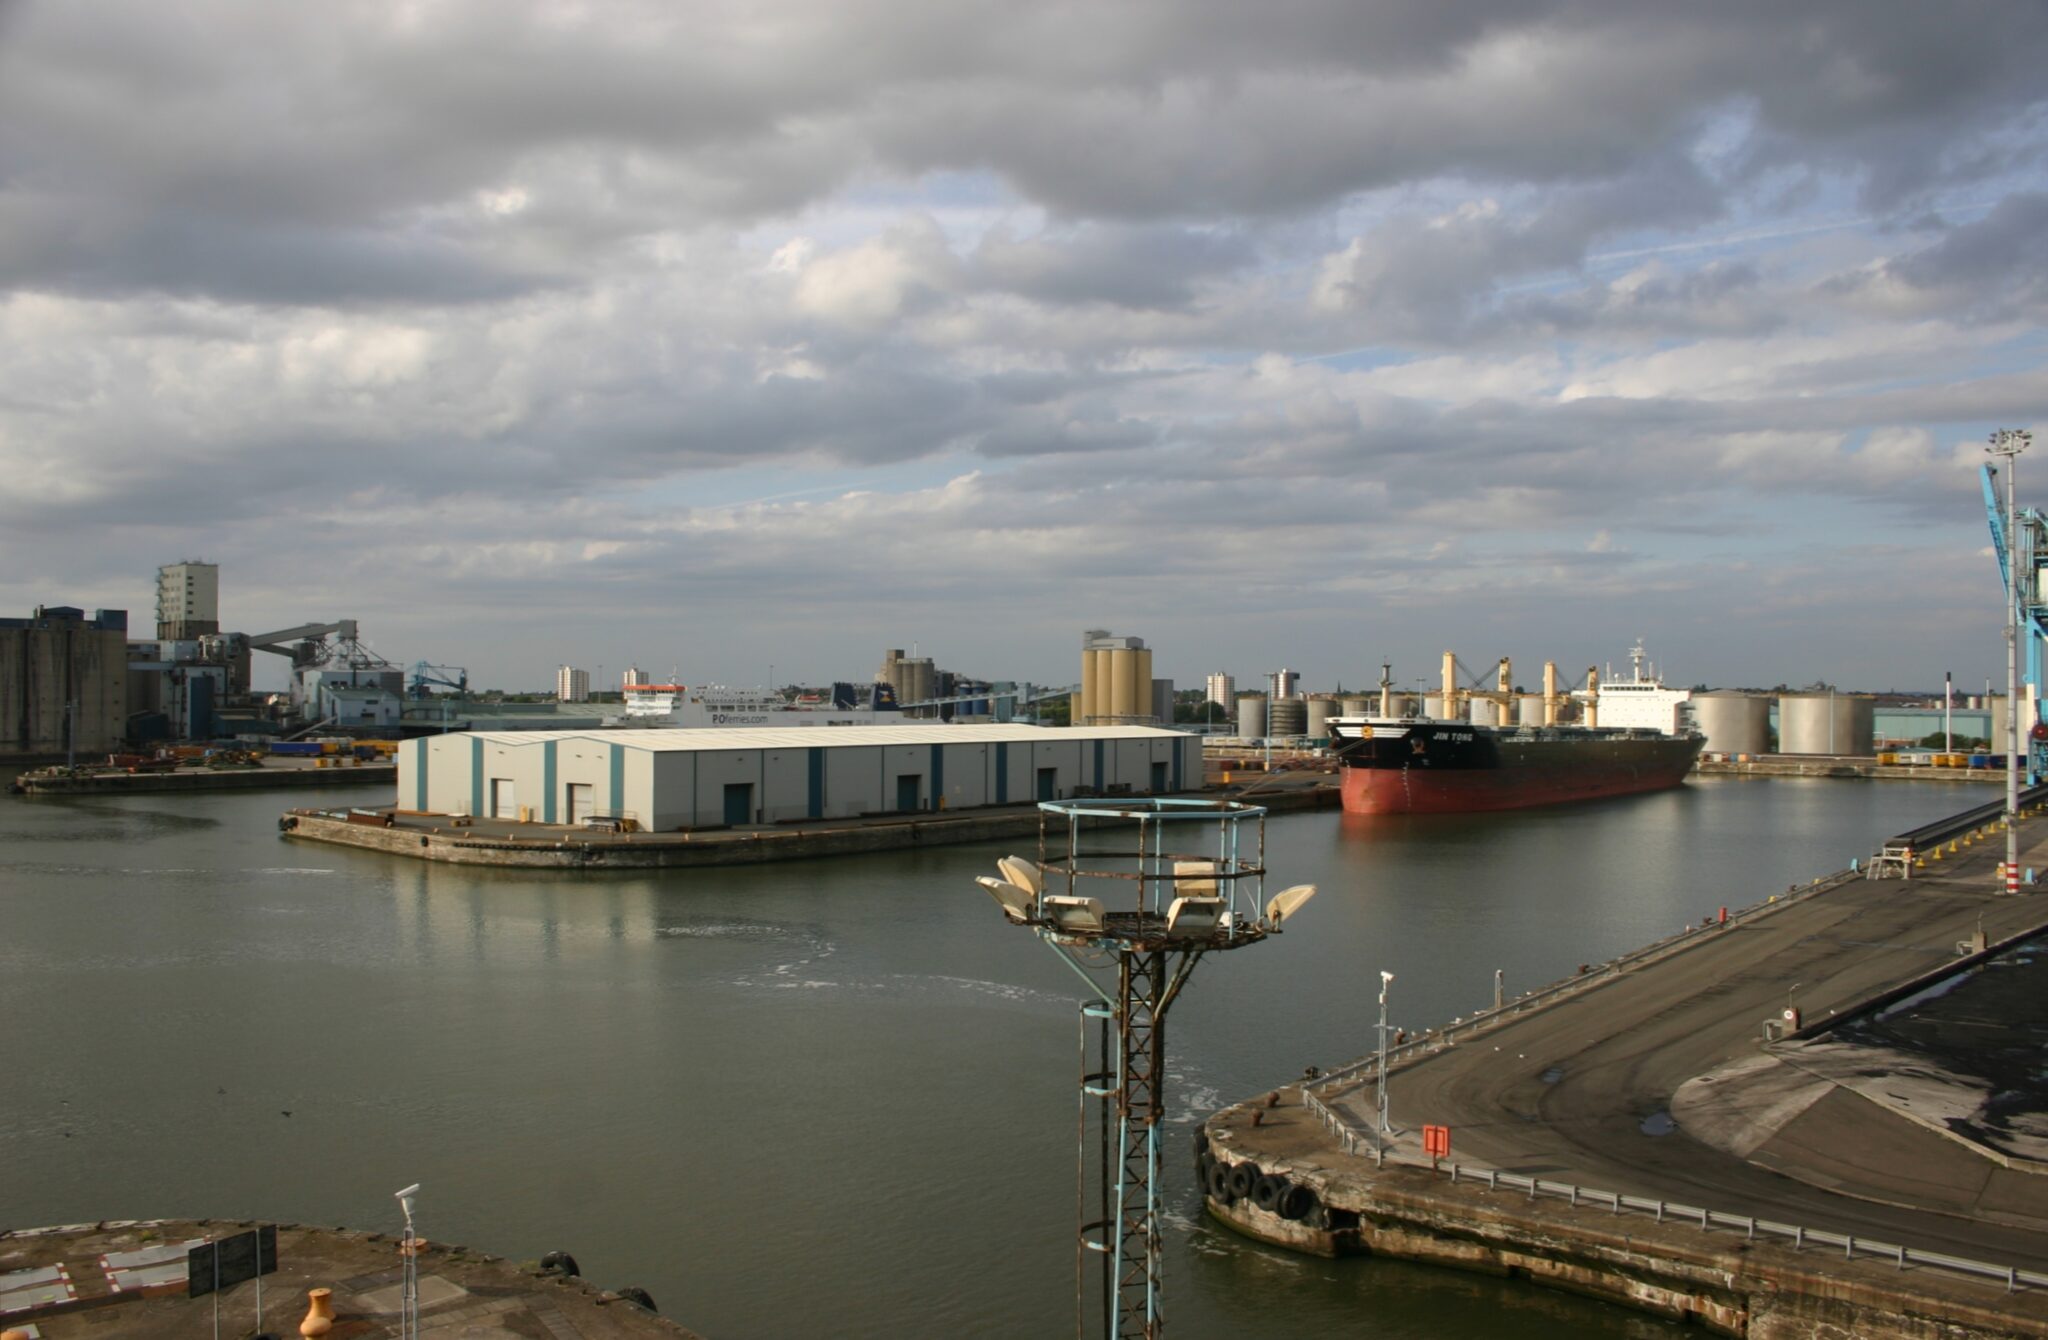
mountains, sunset, storm, weather, clouds, ray, darling, rain, lighting, nature, landscape-9504977.jpg

TASK 1 (PROCESS/ DIAGRAM): WEATHER FORECAST

Sample Answer The provided diagram depicts the process by which up-to-the-minute meteorological data is collected by a designated organisation, namely the Australian Bureau of Meteorology, in order to distribute reliable weather forecasts to members of the public. Overall, the largely technologically driven, one-way process consists of numerous steps that can be effectively grouped into three

TASK 1 (PROCESS/ DIAGRAM): WEATHER FORECAST Read More »

microscope, investigation, scientific, laboratory, biology, microscope, microscope, microscope, microscope, microscope, investigation, laboratory, laboratory, laboratory, laboratory, biology-3184432.jpg

TASK 2 (AGREE OR DISAGREE): SCIENTIFIC RESEARCH

Some people think that scientific research should be carried out by the governments rather than private companies. To what extent do you agree or disagree ? Sample Answer There has been considerable debate as to whether scientific research endeavours should be conducted by governmental authorities or private entities, with supporters of both sides citing legitimate

TASK 2 (AGREE OR DISAGREE): SCIENTIFIC RESEARCH Read More »

TASK 2 (AGREE OR DISAGREE): SCIENTIFIC RESEARCH

Some people think that scientific research should be carried out by the governments rather than private companies. To what extent do you agree or disagree ? Sample Answer There has been a considerable debate as to whether scientific research endeavours should be conducted by governmental authorities or private entities, with supporters of both sides citing

TASK 2 (AGREE OR DISAGREE): SCIENTIFIC RESEARCH Read More »

TASK 1 (BAR CHARTS): URBAN POPULATION GROWTH

The chart below gives information about the growth of the urban population in certain parts of the world including the prediction of the future. Summarise the information by selecting and reporting the main features and make comparisons where relevant. Sample Answer The provided bar chart displays information about the rates of urban population growth in

TASK 1 (BAR CHARTS): URBAN POPULATION GROWTH Read More »