Sample Answer
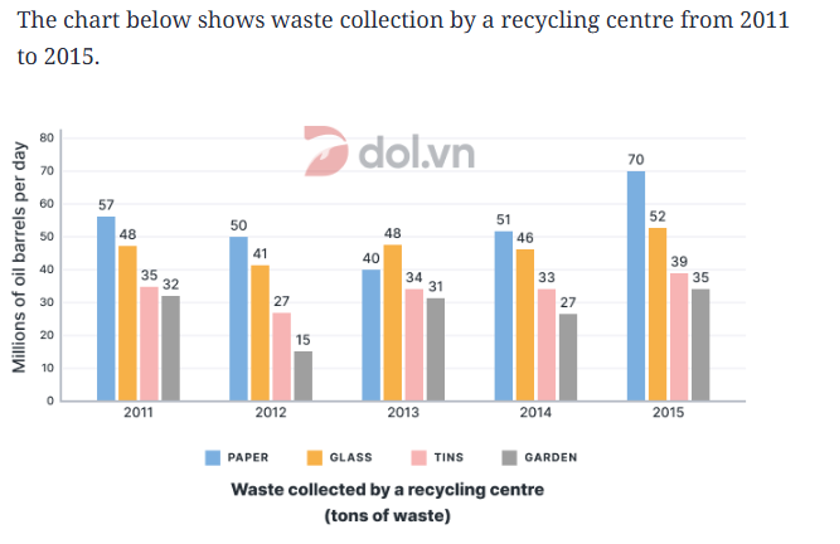
The provided bar chart illustrates the waste accumulation tonnages recorded by a particular recycling facility across four distinct categories of disposables between 2011 and 2015.
What is immediately striking upon observing the data is the expansion of waste volumes, albeit to varying degrees, exhibited by every type of refuse, with paper demonstrating the greatest increase overall, while other waste categories showed relative stability in terms of their collection volumes. Equally noteworthy is the dominance of paper waste in almost all surveyed years, with the sole exception of 2013, during which glass emerged as the most prominent type of refuse. Also, by the final year of the period, the relative rankings had been preserved, despite the notable hierarchical reversal midway through the timeline.
Examining initially the most collected types of waste, paper commenced the timeline by recording 57 tonnes, leading all categories and standing around 10 tonnes ahead of glass, which occupied second position. Paper tonnage thereafter contracted, characterised by a decline in collected volume, bottoming out at 40 tonnes in 2013, after which this particular recycled item regained lost ground, marked by a partial recovery to 51 tonnes a year later. Only in 2013 was paper collection outnumbered by that of glass, being surpassed by 8 tonnes. Having mounted a resurgence, paper picked up pace once more, ascending to a peak of 70 tonnes, the highest figure across the board. Glass, on the other hand, saw its collection fluctuate within a relatively narrow range from 41 to 52 tonnes; yet this category culminated the timeline with a positive net gain of 4 tonnes, securing its second-place ranking.
Shifting attention to the less prevalent waste types, at no point during the timeline did tins and garden compost alter their rankings relative to the leading waste categories. Tins, starting at 35 tonnes in 2011, experienced a notable decline of 8 tonnes in the ensuing year, followed by a recovery and a plateau until 2014. Thereafter, this type of household waste saw a slight expansion in collection volume, ending the period with a net gain of 4 tonnes. Lastly, garden compost remained relatively steady around the 32- to 35-tonne mark, with the only exception occurring in 2012, when the accumulation volume dipped to 15 tonnes, the smallest figure across the board.
Vocabulary
| expansion of waste volumes | sự gia tăng lượng rác |
| albeit to varying degrees | mặc dù ở các mức độ khác nhau |
| refuse | rác thải |
| greatest increase overall | mức tăng lớn nhất |
| other waste categories | các loại rác khác |
| in terms of | về mặt |
| paper waste | rác giấy |
| almost all | gần như tất cả |
| the sole exception | ngoại lệ duy nhất |
| during which | trong giai đoạn đó |
| emerged | nổi lên, xuất hiện |
| prominent type | loại nổi bật |
| by the final year of the period | vào năm cuối của giai đoạn |
| relative rankings | thứ hạng tương đối |
| preserved | được duy trì |
| despite the notable hierarchical reversal | mặc dù có sự đảo chiều đáng kể |
| midway through | giữa chừng |
| by recording | với việc ghi nhận |
| standing around … tonnes ahead of | cao hơn khoảng … tấn |
| characterised by a decline | được đặc trưng bởi sự suy giảm |
| bottoming out at | chạm đáy ở mức |
| regained lost ground | phục hồi phần đã mất |
| having mounted a resurgence | sau khi phục hồi trở lại |
| fluctuate within a relatively narrow range | dao động trong phạm vi tương đối hẹp |
| culminated the timeline with a positive net gain | kết thúc giai đoạn với mức tăng ròng dương |