
Writing Task 1

TASK 1 (Mixed charts): Cinema attendance

Sample Answer The provided table and line graph illustrate a notable shift in demographic patterns regarding cinema-going behaviour, alongside a breakdown of attendance levels for all age cohorts during the period between 1996 and 2000. What is immediately striking upon observing the data is the dichotomy between attendance rates and visit frequency: while participation was

TASK 1 (Mixed charts): Cinema attendance Read More »

TASK 1 (Pie Chart): Voluntary contributions

Sample Answer The provided pie charts illustrate a notable shift in voluntary participation across six distinct disciplines between 2008 and 2014. What is immediately striking upon observing the data is the pronounced polarisation exhibited in the restructuring of charitable involvement, characterised by the growing representation of environmental and athletic organisations, the dwindling appeal of artistic,

TASK 1 (Pie Chart): Voluntary contributions Read More »

TASK 1 (Bar Chart): Waste collection

Sample Answer The provided bar chart illustrates the waste accumulation tonnages recorded by a particular recycling facility across four distinct categories of disposables between 2011 and 2015. What is immediately striking upon observing the data is the expansion of waste volumes, albeit to varying degrees, exhibited by every type of refuse, with paper demonstrating the

TASK 1 (Bar Chart): Waste collection Read More »

TASK 1 (Bar Chart): Cinema-goers

Sample Answer The provided bar chart illustrates cinema-going patterns across the seven days of a typical week in a particular European country between 2003 and 2007. What is immediately striking from the chart is the pronounced polarisation of cinema-going behaviour, characterised by the growing appeal of Monday, Thursday, Saturday, and Sunday, accompanied by waning interest

TASK 1 (Bar Chart): Cinema-goers Read More »

TASK 1 (Bar chart): Parental involvement

Sample Answer The provided bar chart illustrates the varying degrees of parental involvement across four distinct categories of child-minding activity in 2013. What is immediately striking upon observing the data is the readily apparent pattern of mother dominance exhibited in all child-related pursuits, with the largest proportional discrepancy between parents occurring within child dressing. Equally

TASK 1 (Bar chart): Parental involvement Read More »

TASK 1 (Mixed charts): Demographic Composition

Sample Answer The provided table illustrates Australia’s population distribution based on nationality, while the table demonstrates where these nationalities were concentrated, either in urban or rural areas. What is immediately striking upon observing the data is the overwhelming dominance of Australian-born citizens, which stood in stark opposition to other unspecified nationals, whereas the remaining nationalities

TASK 1 (Mixed charts): Demographic Composition Read More »

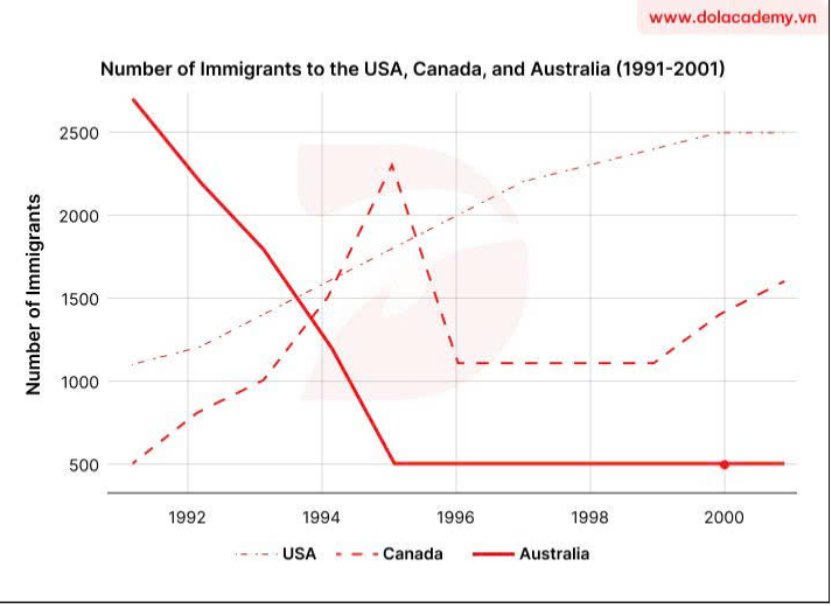
TASK 1 (Line graph): Immigrants 

The line graph shows the number of immigrants to 3 different countries (USA,Canada, Australia) from 1991 to 2001. Summarise the information by selecting and reporting the main features, and make comparisons where relevant.  Sample Answer  The provided line graph illustrates immigration totals to three distinct countries — namely the USA, Canada, and Australia — during

TASK 1 (Line graph): Immigrants  Read More »