Sample Answer
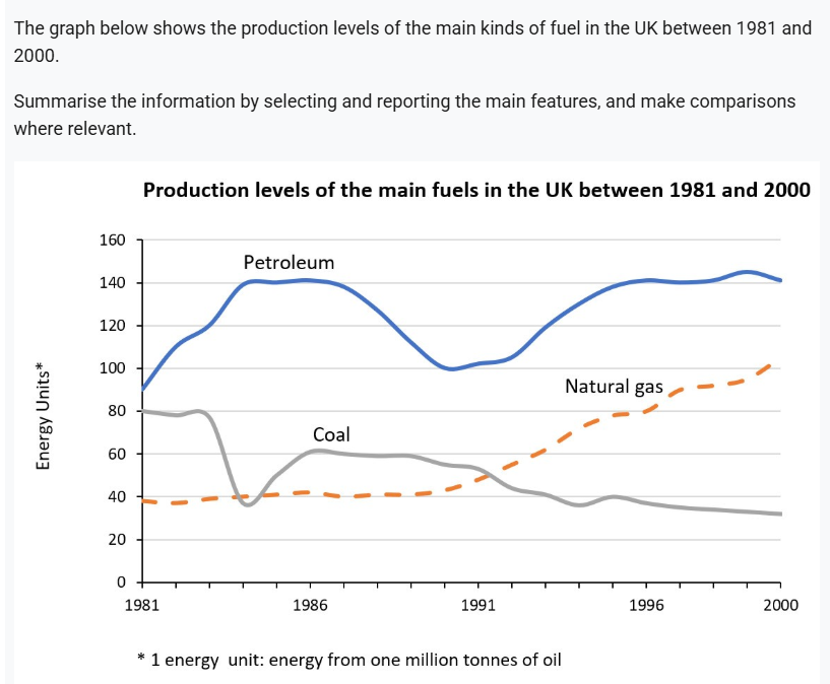
The provided line graph illustrates the production outputs of three distinct fossil fuels in the UK during the period from 1981 to 2000.
What is immediately striking upon observing the data is the expansion in production of petroleum and natural gas, albeit to differing magnitudes, standing in stark opposition to coal, which saw a contraction in production. Equally noteworthy is the sustained dominance of petroleum as the predominant fuel, while the opposing trajectories exhibited by the remaining fossil fuels had, by the final year, reversed their relative rankings, placing natural gas above coal.
Examining initially the most prolifically produced fossil fuel, petroleum commenced the timeline at approximately 90 energy units, moderately surpassing the comparatively lower 80 units of coal, whereas natural gas, at the outset, trailed substantially behind at just below 40 units. Having experienced an initial pronounced expansion in output, the figure for petroleum surged to a high of 140 energy units in 1984, after which its output level largely stabilized, hovering at around 140 units until 1987. This initial burgeoning growth was, nevertheless, short-lived, as the fuel’s production figure trended down to bottom out at 100 units in the early 1990s, followed by a three-year period of relative stagnation with minimal variations. Thereafter, petroleum picked up pace once more, with its figure recovering to culminate the timeline at 140 energy units, representing a net gain of 40 units and thereby consolidating its dominance throughout the period.
Shifting focus to the less prominent fossil fuel sources, natural gas exhibited a consistent growth trajectory, despite an initial decade of relatively limited change. Nevertheless, the early 1990s saw burgeoning production of natural gas, with the figure rising to overtake coal in 1992, ascending to second place by the end of the period. Having culminated at 100 energy units, natural gas had doubled its production from a mere 40 units at the outset.
Lastly, a reverse trend was observed in coal, whose production level declined markedly, temporarily falling to around 35 units in 1984 before recovering to 60 units in 1986. Henceforth, a downward trend ensued, with coal curtailing its production consistently to end the period at approximately 30 units, the lowest figure among the three fuels.
Vocabulary
| production outputs | sản lượng |
| expansion in production | sự gia tăng sản xuất |
| stark opposition | đối lập rõ rệt |
| contraction in production | sự suy giảm sản xuất |
| sustained dominance | vị thế thống trị kéo dài |
| predominant fuel | nhiên liệu chủ đạo |
| trajectories exhibited by | xu hướng của |
| most prolifically produced | được sản xuất nhiều nhất |
| trailed substantially behind | tụt xa phía sau |
| initial pronounced expansion | giai đoạn tăng mạnh ban đầu |
| surged to a high of | tăng vọt lên mức |
| hovering at | dao động quanh |
| burgeoning growth | tăng trưởng bùng nổ |
| trended down | có xu hướng giảm |
| bottom out at | chạm mức thấp nhất |
| relative stagnation | sự đình trệ tương đối |
| picked up pace | tăng tốc |
| culminate the timeline at | kết thúc ở mức |
| net gain of | mức tăng ròng |
| consolidating its dominance | củng cố vị thế thống trị |
| consistent growth trajectory | xu hướng tăng trưởng ổn định |
| burgeoning production | sản lượng tăng mạnh |
| reverse trend | xu hướng ngược lại |
| downward trend ensued | xu hướng giảm tiếp diễn |
| curtailing its production | cắt giảm sản lượng |