
Sample Answer
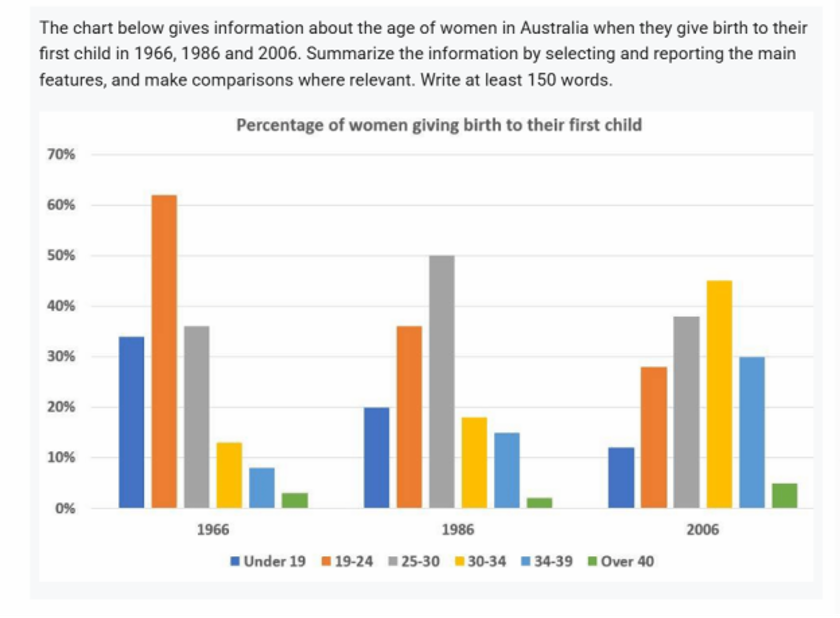
The provided bar chart illustrates the percentage of women who gave birth to their first child in Australia across six age groups in three different years: 1966, 1986, and 2006.
What is immediately striking from the chart is the notable pattern of delayed motherhood, characterized by the postponement of first childbirth among women. This shift was reflected in the declining proportion of mothers in the younger age groups, the relative stability of those aged 25-29, and the growing shares of women having their first child in the older age categories. Equally noteworthy is that while the age of first-time motherhood tended to increase over time, the oldest age cohort remained the least represented throughout the period.
Examining the younger age brackets first, women under the age of 19 showed a diminishing tendency to have their first child. Although this group accounted for around one-third of all first-time mothers in 1966, its share experienced a threefold decline to just over 10% by 2006, thereby becoming the second-smallest group at the end of the period. Meanwhile, the lion’s share of women had their first offspring between the ages of 19 and 24. This was the most popular age range in 1966, accounting for just over 60% of first births. Nevertheless, a similar pattern was observed, with the figure more than halving to below 30% in 2006, placing this category in the middle of the distribution.
Turning to the middle-aged group, a relatively stable pattern was evident among women aged 25 to 29. Despite rising to exactly 50% in 1986, the figure subsequently fell to just under 40% in 2006. Overall, this age group experienced only a marginal increase over the period.
Finally, regarding the older age groups, the largest relative increase was recorded among women aged 30 to 34. Starting at just over 10% in 1966, the figure more than quadrupled to approximately 45% in 2006, making it the highest figure across the board by the end of the period. A largely similar trend was observed among women aged 35 to 39, whose proportion more than tripled from below 10% to around 30%, leaving it on par with the figure for those aged 19 to 24. Last but not least, women aged over 40 showed a consistently low level of first-time motherhood despite a modest upward trend. Beginning at almost zero in 1966, this figure rose to around 5% by 2006, retaining its position as the smallest category throughout the period.
Vocabulary
| percentage of women | tỷ lệ phụ nữ |
| first child | con đầu lòng |
| notable pattern of delayed parenthood | xu hướng trì hoãn làm cha mẹ đáng chú ý |
| postponement of first childbirth | sự trì hoãn sinh con đầu lòng |
| declining proportion | tỷ lệ giảm |
| younger age groups | nhóm tuổi trẻ hơn |
| relative stability | sự ổn định tương đối |
| growing shares | tỷ lệ gia tăng |
| oldest age cohort | nhóm tuổi cao nhất |
| women under the age of 19 | phụ nữ dưới 19 tuổi |
| threefold decline | giảm gấp ba lần |
| lion’s share of women | phần lớn phụ nữ |
| first offspring | con đầu lòng |
| similar pattern | xu hướng tương tự |
| more than halving | giảm hơn một nửa |
| middle of the distribution | vị trí trung bình trong phân bố |
| relatively stable pattern | xu hướng tương đối ổn định |
| marginal increase | mức tăng nhẹ |
| largest relative increase | mức tăng tương đối lớn nhất |
| more than quadrupled | tăng hơn bốn lần |
| highest figure across the board | mức cao nhất trong tất cả các nhóm |
| largely similar trend | xu hướng nhìn chung tương tự |
| more than tripled | tăng hơn ba lần |
| on par with | ngang bằng với |
| modest upward trend | xu hướng tăng nhẹ |