
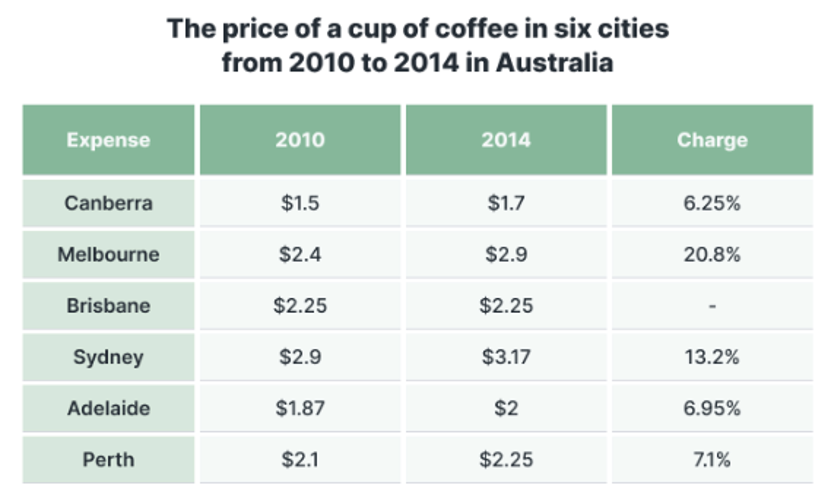
The table below shows the prices of a cup of coffee in 6 cities in Australia in 2010 and 2014. Summarise the information by selecting and reporting the main features, and make comparisons where relevant.
Sample Answer
The provided table illustrates the price variation of a cup of coffee across six distinct cities in Australia during a five-year period from 2010 to 2014, alongside the percentage differences recorded in each city.
What is immediately striking upon observing the data is the persistent position of Sydney at the absolute top of the hierarchy regarding per-cup coffee prices; however, the proportional change in this city was markedly eclipsed by Melbourne, which registered the highest price growth despite boasting the second-highest prices. Equally noteworthy is the broadly consistent pattern of price inflation, characterised by rising prices across almost all cities, except for Brisbane, where the per-cup price remained static.
Examining initially the cities with the most pronounced price increases, Melbourne held a substantial lead over the other cities examined, logging a conspicuous rise of 20.8%. This change was driven by an upward price adjustment from $2.4 to $2.9 over the five-year period, equivalent to a $0.5 increase. Such a proportional price adjustment sharply surpassed the growth demonstrated in Sydney, where a comparatively lower rise of 13.2% was accompanied by a price increase of just over $0.2. Despite having a lower growth rate, Sydney led the country in pricing in both years, with figures towering over those of the remaining cities.
Shifting attention to cities with lower growth levels, Canberra and Adelaide recorded largely comparable rates of increase, with the latter narrowly edging out the former at nearly 7%, compared with a slightly lower figure of 6.25%. Nevertheless, their prices told a markedly different story. The cost of a cup of coffee in Adelaide was around $0.3 higher than that reported in Canberra. While the former saw its price rise from $1.87 to $2.00 over the five-year period, the latter largely mirrored this trend, albeit with more subdued figures of $1.5 and $1.7 respectively.
Turning finally to the remaining cities, complete price stability was observed only in Brisbane, as exemplified by the unchanged cost of a cup of coffee. This beverage was priced at $2.25 in both years, indicating no growth whatsoever. Interestingly, Perth was the city where prices eventually reached parity with Brisbane at $2.25 in 2014, although consumers could purchase the same cup of coffee there for $2.1 in 2010. This change signified a rise of 7.1%, placing Perth among the cities with the lowest percentage increases.
Vocabulary
| percentage of women | tỷ lệ phụ nữ |
| first child | con đầu lòng |
| notable pattern of delayed parenthood | xu hướng trì hoãn làm cha mẹ đáng chú ý |
| postponement of first childbirth | sự trì hoãn sinh con đầu lòng |
| declining proportion | tỷ lệ giảm |
| younger age groups | nhóm tuổi trẻ hơn |
| relative stability | sự ổn định tương đối |
| growing shares | tỷ lệ gia tăng |
| oldest age cohort | nhóm tuổi cao nhất |
| women under the age of 19 | phụ nữ dưới 19 tuổi |
| threefold decline | giảm gấp ba lần |
| lion’s share of women | phần lớn phụ nữ |
| first offspring | con đầu lòng |
| similar pattern | xu hướng tương tự |
| more than halving | giảm hơn một nửa |
| middle of the distribution | vị trí trung bình trong phân bố |
| relatively stable pattern | xu hướng tương đối ổn định |
| marginal increase | mức tăng nhẹ |
| largest relative increase | mức tăng tương đối lớn nhất |
| more than quadrupled | tăng hơn bốn lần |
| highest figure across the board | mức cao nhất trong tất cả các nhóm |
| largely similar trend | xu hướng nhìn chung tương tự |
| more than tripled | tăng hơn ba lần |
| on par with | ngang bằng với |
| modest upward trend | xu hướng tăng nhẹ |