

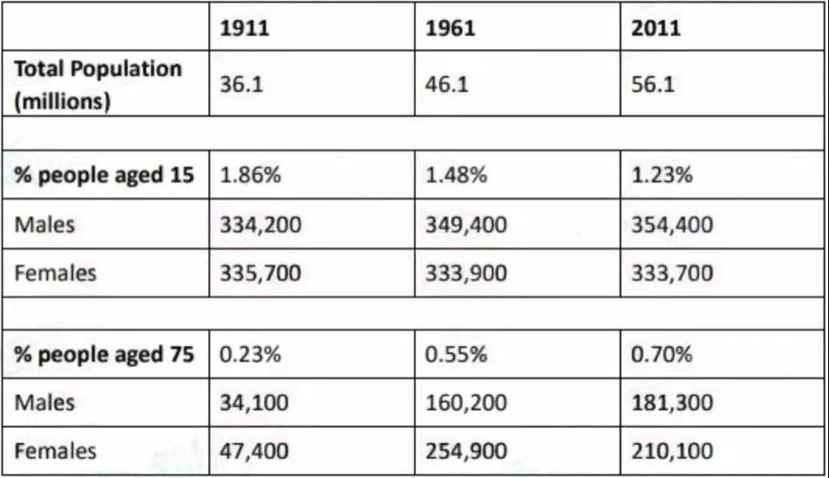
The table below shows the total population and the proportion of males and females aged 15 and aged 75 in the UK from 1911 to 2011. Summarize the information by selecting and reporting the main features, and make comparisons where relevant.
Sample Answer
The provided table illustrates demographic statistics in the UK, outlining key information regarding trends in the aggregate population and the demographic composition of 15-year-old and 75-year-old males and females during the period from 1911 to 2011.
What is immediately striking from the data is the rapid and sustained growth of the UK’s population throughout the century, characterised by the shrinking proportion of the younger age group and the comparatively marked expansion of the older cohort, both of which indicate a progressively ageing population. Equally noteworthy is the marked divergence between the two age groups, with a general male preponderance among 15-year-olds, whereas the older demographic exhibited a notable female dominance.
The UK’s total population experienced a steady upward trend over the period. Standing at just over 36 million in 1911, the population increased steadily in a linear and sustained manner, rising by approximately 10 million every 50 years and peaking at 56.1 million by the end of the period. This ascent resulted in a net gain of roughly 20 million people over the century.
A detailed breakdown of the figures reveals a gradual contraction in the proportion of those aged 15, with their share of the population declining from 1.86% in 1911 to 1.23% in 2011, representing a reduction of 0.63 percentage points. In terms of gender distribution, the number of females in this age group remained relatively stable, decreasing marginally from 335,700 to 333,700. By contrast, the number of males rose gradually from 334,200 to 354,400, recording a modest increase of around 20,000 individuals and thereby reversing the gender balance by the end of the period.
Regarding the population aged 75, the trend was entirely different. Their proportion rose substantially, climbing from 0.23% in 1911 to 0.70% in 2011, which represents a more than threefold increase. While the number of elderly males increased dramatically from 34,100 to 181,300, the corresponding figure for females grew from 47,400 to 210,100 despite experiencing a decline after reaching a peak of 254,900 in 1961. Throughout the period, females consistently outnumbered their male counterparts, thereby reinforcing the pattern of female dominance among older adults.
Vocabulary
| aggregate population | tổng dân số |
| demographic composition | cơ cấu dân số |
| rapid and sustained growth | tăng trưởng nhanh và bền vững |
| characterised by | được đặc trưng bởi |
| shrinking proportion | tỷ trọng thu hẹp |
| marked expansion | sự gia tăng đáng kể |
| cohort | nhóm nhân khẩu |
| ageing population | dân số già hóa |
| marked divergence | sự khác biệt rõ rệt |
| a general male preponderance | sự áp đảo của nam giới |
| female dominance | sự chiếm ưu thế của nữ giới |
| steady upward trend | xu hướng tăng ổn định |
| increased steadily | tăng đều đặn |
| linear and sustained manner | theo cách tuyến tính và bền vững |
| peaking at | đạt đỉnh ở |
| by the end of the period | vào cuối giai đoạn |
| ascent | sự gia tăng |
| net gain | mức tăng ròng |
| gradual contraction | sự suy giảm dần |
| declining from | giảm từ |
| a reduction of | sự giảm xuống của |
| remained relatively stable | duy trì tương đối ổn định |
| rose gradually | tăng dần |
| a modest increase | mức tăng khiêm tốn |
| reversing the gender balance | đảo ngược cân bằng giới tính |