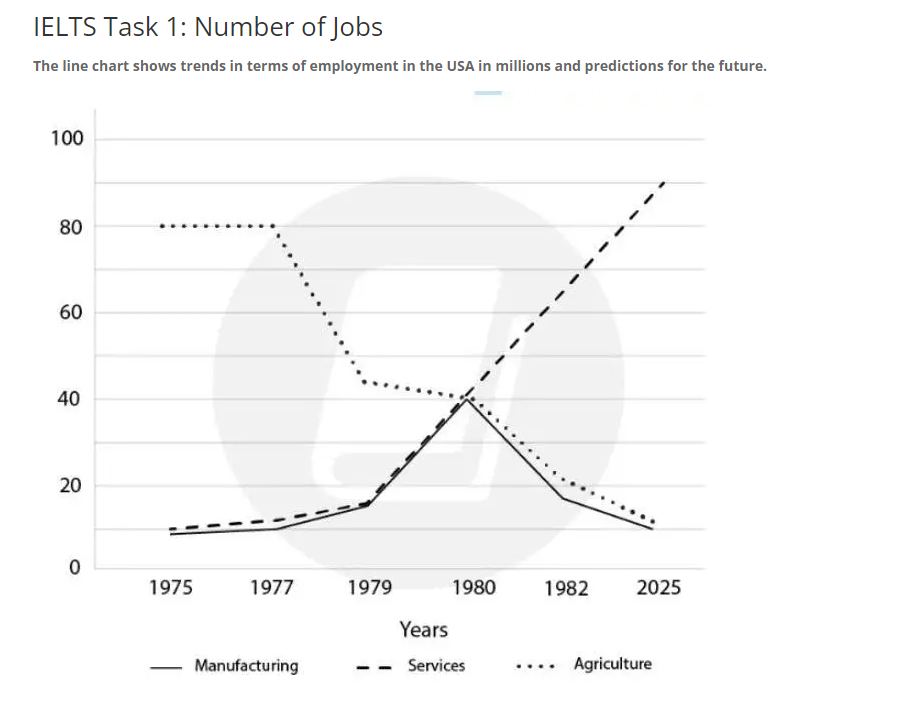
The line graph delineates past changes in the employment patterns in three different industries in America and future predictions, in millions.
Overall, employment statistics in the agrarian sector decreased and will likely continue a downward trend, services have seen an increase and are expected to maintain a rise, and the rate of employment in the manufacturing industry should stay fixed at the end of the projected period despite a peak in 1980. Agriculture, though leading all categories at the beginning of the timeline, will be eventually surpassed by jobs in the service industry by 2025.
Agriculture dominated all industries in 1975, registering 80 million jobs, eight times the figure for services, at 10 million. While those employed in agriculture were flat until 1977, they fell precipitously to over 40 million in 1979 and declined, but to a lesser extent, to 40 million in 1980. Meanwhile, there was a gradual rise in the service sector to around 15 million in 1979 and another steeper increase to intersect with agriculture at 40 million in 1980. From then, the trends of the two sectors continued, with agriculture falling to an expected 10 million and services rising to an anticipated 90 million in 2025.
Manufacturing, on the other hand, followed a roughly similar trend to services from 1975 to 1980 when this sector reached its all-time high at 40 million before witnessing a drop to roughly 18 million in 1982. Finally, a further decline is projected to 10 million jobs in 2025.
(248 words)
Essay breakdown
Introduction:
[1] The line graph delineates past changes in the employment patterns in three different industries in America and future predictions, in millions.
[2] Overall, employment statistics in the agrarian sector decreased and will likely continue a downward trend, services have seen an increase and are expected to maintain a rise, and the rate of employment in the manufacturing industry should stay fixed at the end of the projected period despite a peak in 1980. [3] Agriculture, though leading all categories at the beginning of the timeline, will be eventually surpassed by jobs in the service industry by 2025.
- Write a general statement to introduce the topic
- Write a clear overview to summarise the trends of all sectors
- Provide comparisons of the main variables
Body 1:
[1] Agriculture dominated all industries in 1975, registering 80 million jobs, eight times the figure for services, at 10 million. [2] While those employed in agriculture were flat until 1977, they fell precipitously to over 40 million in 1979 and declined, but to a lesser extent, to 40 million in 1980. [3] Meanwhile, there was a gradual rise in the service sector to around 15 million in 1979 and another steeper increase to intersect with agriculture at 40 million in 1980. [4] From then, the trends of the two sectors continued, with agriculture falling to an expected 10 million and services rising to an anticipated 90 million in 2025.
- Starting points: Agriculture vs Services
- Describe agriculture to 1980
- Describe the service sector to 1980
- Describe both sectors together until 2025
Body 2:
[1] Manufacturing, on the other hand, followed a roughly similar trend to services from 1975 to 1980 when this sector reached its all-time high at 40 million before witnessing a drop to roughly 18 million in 1982. [2] Finally, a further decline is projected to 10 million jobs in 2025.
- Describe the manufacturing
- Continue with the future trend
Vocabulary:
The line graph delineates past changes in the employment patterns in three different industries in America and future predictions, in millions.
Overall, employment statistics in the agrarian sector decreased and will likely continue a downward trend, services have seen an increase and are expected to maintain a rise, and the rate of employment in the manufacturing industry should stay fixed at the end of the projected period despite a peak in 1980. Agriculture, though leading all categories at the beginning of the timeline, will be eventually surpassed by jobs in the service industry by 2025.
Agriculture dominated all industries in 1975, registering 80 million jobs, eight times the figure for services, at 10 million. While those employed in agriculture were flat until 1977, they fell precipitously to over 40 million in 1979 and declined, but to a lesser extent, to 40 million in 1980. Meanwhile, there was a gradual rise in the service sector to around 15 million in 1979 and another steeper increase to intersect with agriculture at 40 million in 1980. From then, the trends of the two sectors continued, with agriculture falling to an expected 10 million and services rising to an anticipated 90 million in 2025.
Manufacturing, on the other hand, followed a roughly similar trend to services from 1975 to 1980 when this sector reached its all-time high at 40 million before witnessing a drop to roughly 18 million in 1982. Finally, a further decline is projected to 10 million jobs in 2025.
Vocabulary Highlights:
- line graph: a graph that displays data as a series of points connected by a line.
- employment patterns: the trends in the number of people employed in different industries.
- agrarian sector: the agricultural industry.
- downward trend: a decrease in numbers or a decline.
- service industry: the sector of the economy that provides services rather than goods.
- manufacturing industry: the sector of the economy that produces goods.
- fixed rate: a stable or unchanging rate.
- projected period: the estimated time frame in the future.
- dominate: to be the most significant or prevalent.
- figure: a number.
- flat: unchanging or steady.
- precipitously: suddenly or rapidly.
- steeper increase: a more significant rise or increase.
- intersect: to cross or meet at a point.
- all-time high: the highest level ever reached.
Diamond Grammar:
COMPLEX SENTENCE
“Meanwhile, there was a gradual rise in the service sector to around 15 million in 1979 and another steeper increase to intersect with agriculture at 40 million in 1980”
The clause “there was a gradual rise in the service sector to around 15 million in 1979” is followed by another clause that is connected to the first by the conjunction “and.” The second clause “another steeper increase to intersect with agriculture at 40 million in 1980” provides additional information on the rise of the service sector, and the use of the word “intersect” adds a layer of complexity to the description of the trends in employment.
Reading:
Further reading about this topic can be found here:
https://www.forbes.com/sites/karadennison/2023/01/09/what-to-expect-from-the-job-market-in-2023/
Listening:
Further listening about this topic can be found here: