Sample Answer
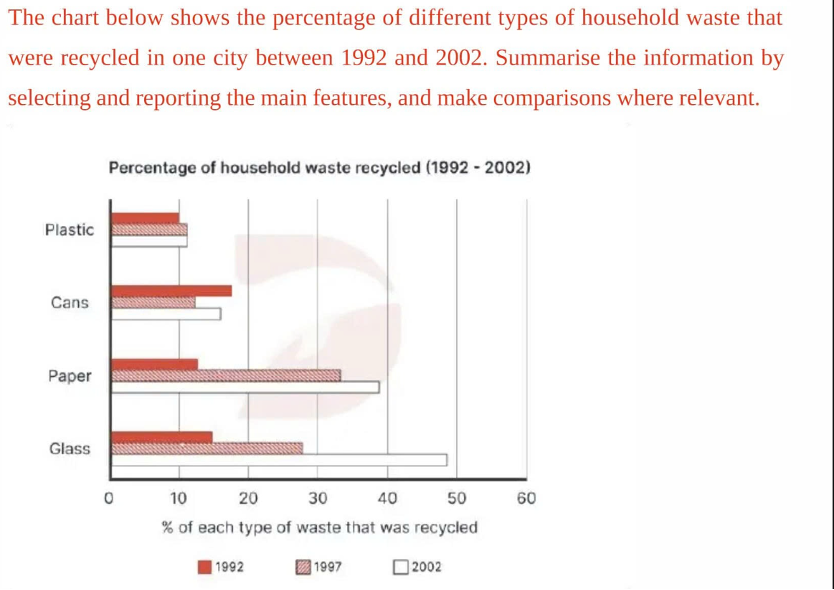
The provided bar chart illustrates recycling awareness levels among urban residents in a particular city across four distinct categories of household refuse — namely plastics, cans, paper, and glass — during 5-year intervals between 1992 and 2002.
What is immediately striking upon observing the data is a shifting public attitude towards recycling, exhibited in three out of four waste categories, with the sole exception of canned products, which saw a mild decrease overall. Equally noteworthy is the dominance of paper and glass as reusable items in the final two years of the period, which markedly surpassed plastics and bottles.
Canned items, initially, were the most heavily recycled, consisting of around 18% of the total household wastage. This figure, despite leading all types of waste, only moderately edged out the corresponding numbers for plastics, paper, and glass — all of which logged approximately 10% to 14% apiece. Recycling-driven inclinations among urban inhabitants, nevertheless, experienced pronounced shifts during the following years.
The least alterations in terms of recycling awareness occurred among plastic and canned products. Not only did the former experience a marginal uptick concerning recycled waste to roughly 11% in 1997, this figure also plateaued by the end of the timeline, indicative of minimal recycling incentives within the domain of plastics. Meanwhile, nowhere other than within the category of cans was a declining trajectory observed. In 1997, as a matter of fact, a drop of around three percentage points was registered, only for a subsequent recovery to lift the figure to near its 1992 data point. However, this still showed a net dip of around two percentage points.
On the other end of the spectrum, the most pronounced gains were seen within the realm of paper and glass. Paper underwent a staggering threefold increase, in estimation, ending the period at close to 40%. Remarkable this rise was, it yet lifted paper’s figure to the leading position. This is because glass doubled its number in 1997, characterised by a leap to nearly 30%, after which the figure nearly doubled again, culminating the timeline at almost 50%. This represented a nearly fourfold jump — with glass ascending to the leadership position, even far surpassing its second highest, paper, at nearly 40%.
Vocabulary
| recycling awareness levels | mức độ nhận thức tái chế |
| household refuse | rác thải sinh hoạt |
| 5-year intervals | khoảng thời gian 5 năm |
| immediately striking | nổi bật ngay lập tức |
| shifting public attitude | thái độ công chúng thay đổi |
| mild decrease overall | giảm nhẹ tổng thể |
| dominance of paper and glass | sự chiếm ưu thế của giấy và thủy tinh |
| reusable items | vật dụng có thể tái sử dụng |
| markedly surpassed | vượt trội rõ rệt |
| most heavily recycled | được tái chế nhiều nhất |
| moderately edged out | nhỉnh hơn một chút |
| logged approximately | ghi nhận khoảng |
| recycling-driven inclinations | xu hướng thúc đẩy tái chế |
| experienced pronounced shifts | trải qua sự thay đổi rõ rệt |
| alterations in terms of recycling awareness | sự thay đổi về nhận thức tái chế |
| marginal uptick | tăng nhẹ |
| plateaued by the end of the timeline | chững lại vào cuối giai đoạn |
| minimal recycling incentives | động lực tái chế tối thiểu |
| domain of plastics | lĩnh vực nhựa |
| declining trajectory observed | xu hướng giảm được ghi nhận |
| subsequent recovery | sự phục hồi sau đó |
| net dip | giảm ròng |
| other end of the spectrum | phía đối lập của phổ |
| pronounced gains | mức tăng rõ rệt |
| realm of paper and glass | lĩnh vực giấy và thủy tinh |
| staggering threefold increase | mức tăng gấp ba đáng kinh ngạc |
| leading position | vị trí dẫn đầu |
| characterised by a leap | được đặc trưng bởi một bước nhảy |
| culminating the timeline | kết thúc giai đoạn |
| fourfold jump | tăng gấp bốn lần |
| ascending to the leadership position | vươn lên vị trí dẫn đầu |