
Sample Answer
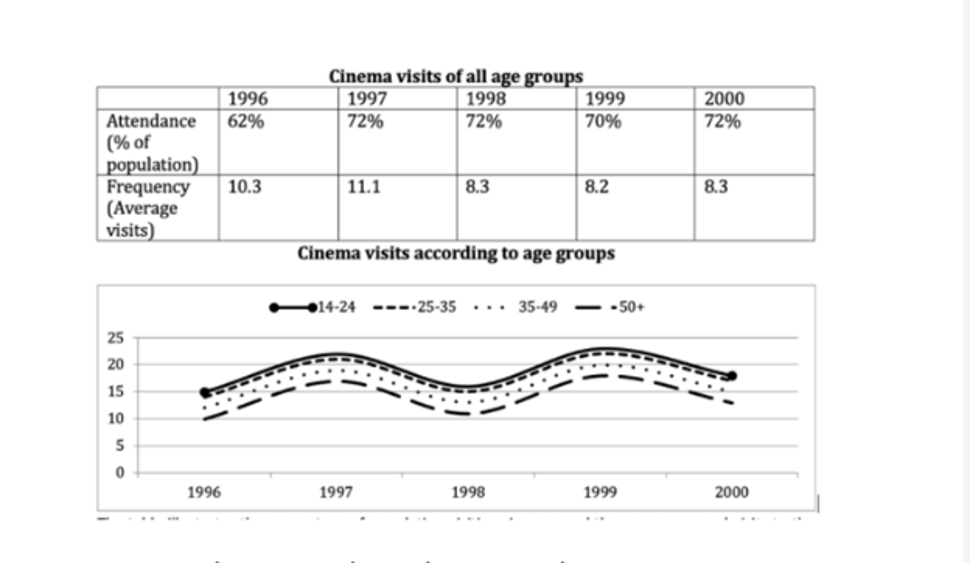
The provided table and line graph illustrate a notable shift in demographic patterns regarding cinema-going behaviour, alongside a breakdown of attendance levels for all age cohorts during the period between 1996 and 2000.
What is immediately striking upon observing the data is the dichotomy between attendance rates and visit frequency: while participation was characterised by a sharp initial expansion, followed by a period of plateauing, the average frequency of visits was marked by a contraction, which precipitated a subsequent period of stagnation. Equally noteworthy is the prevailing dominance of teenagers and young adults in terms of cinema attendance, which stood in stark contrast to their 50+ counterparts, who recorded the lowest levels of involvement throughout the period, notwithstanding broadly analogous trajectories across all demographics.
The cinema attendance profile demonstrated a divergent trend, marked most notably by the growing popularity of cinema-going over the surveyed period. Clearly, the initial year (1996) saw around two-thirds of the examined population attending cinemas (precisely 62%), a figure that gained substantial ground, reaching 72% in the following year. Thereafter, the attendance rate largely stabilised, with intermittent rises and falls characteristic of a plateau, culminating in a final figure of 72%, representing an increase of 10 percentage points. The measurement of frequency, nevertheless, followed a markedly opposing trend. Despite an initial rise from 10.3 to 11.1 visits, the average visit count receded to 8.3, after which the figure hovered around the 8.2-8.3 range until the end of the period. This decline therefore represented a reduction of approximately 2.8 visits on average.
Shifting attention to demographic patterns, teenagers and young adults aged between 14 and 24 dominated the cinema-going landscape, accounting for 15% in 1996 and modestly edging out their 25-35 counterparts, while individuals aged 35 and above lagged behind markedly, recording figures of approximately 12% and 10% respectively. As the years progressed, all age groups moved in lockstep with one another, generally following the lead of the youngest cohort, which oscillated within a relatively moderate range of 15% to 22%. The examined demographics retained their relative positions, rankings, and overall disparities throughout the timeline, with all figures moving in a broadly similar fashion.
Vocabulary
| notable shift in demographic patterns | sự thay đổi đáng kể về cơ cấu dân số |
| breakdown of attendance levels | phân tích chi tiết mức độ tham dự |
| dichotomy between attendance rates and visit frequency | sự đối lập giữa tỷ lệ tham dự và tần suất |
| participation was characterised by | được đặc trưng bởi |
| sharp initial expansion | sự gia tăng mạnh ban đầu |
| period of plateauing | giai đoạn chững lại |
| average frequency of visits | tần suất ghé thăm trung bình |
| a contraction | sự suy giảm |
| subsequent period of stagnation | giai đoạn đình trệ tiếp theo |
| prevailing dominance | sự thống trị nổi bật |
| stark contrast | sự tương phản rõ rệt |
| broadly analogous trajectories | xu hướng tương tự nhìn chung |
| divergent trend | xu hướng khác biệt |
| gained substantial ground | tăng đáng kể |
| largely stabilised | phần lớn ổn định |
| culminating in | kết thúc ở / dẫn đến |
| markedly opposing trend | xu hướng trái ngược rõ rệt |
| 8.2-8.3 range | khoảng 8,2-8,3 |
| teenagers and young adults | thanh thiếu niên và người trẻ |
| dominated the cinema-going landscape | chiếm ưu thế trong việc đi xem phim |
| modestly edging out their counterparts | nhỉnh hơn đối thủ một chút |
| 35 and above | từ 35 tuổi trở lên |
| lagged behind markedly | tụt lại đáng kể |
| moved in lockstep with one another | biến động đồng bộ với nhau |
| following the lead of the youngest cohort | đi theo xu hướng của nhóm trẻ nhất |
| oscillated | dao động |
| relatively moderate range | phạm vi tương đối vừa phải |
| retained their relative positions | duy trì vị trí tương đối |
| a broadly similar fashion | theo cách tương đối giống nhau |