

Sample Answer
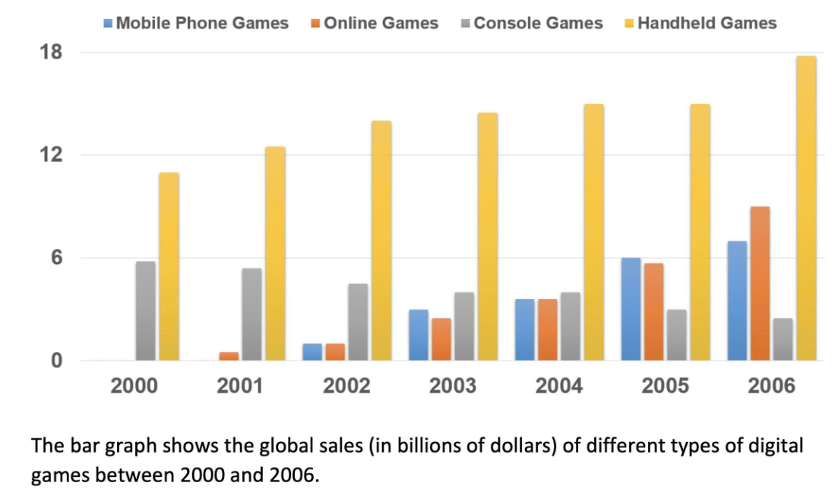
The provided bar chart illustrates the global sales totals – measured in billions of dollars – of four distinct categories of digital gaming options during the period between 2000 and 2006.
What is immediately striking upon observing the data is the sheer dominance of games played on handheld devices, which also gained traction among players, standing in stark opposition to the market offerings consumed on gaming consoles, wherein popularity dwindled substantially. Equally noteworthy is the shared upward momentum demonstrated by Internet-based and mobile games, neither of which were introduced in 2000, albeit to differing magnitudes; by the end of the period, online games had gained significant ground to replace their console counterparts as the second highest-grossing types.
What stands out most conspicuously is the contrasting pattern showcased by handheld and console-based video games; more notably, these options were the only market offerings in 2000. At the outset, handheld recreational options grossed nearly 12 billion dollars, nearly double the corresponding figure for their console counterparts, which stood at just south of 6 billion. Thereafter, the former climbed steadily, yet subtly, sales-wise to around 15 billion dollars in 2004, at which year the figure showed signs of plateauing. This temporary levelling-off, nevertheless, was short-lived as handheld ones surged to peak in 2006, culminating the timeline close to 18 billion dollars and solidifying its dominant position. Games on consoles, conversely, saw a gradual downfall, which slashed their figure to less than 3 billion dollars – translating to approximately a twofold decline. That being said, in proportional terms, it only amounted to one-sixth that of handheld in 2006.
Shifting attention to the remaining options, not until 2001 were online games introduced into the gaming landscape. Starting at a negligible numerical sales amount, Internet-centric games began to gather momentum and gained widespread traction, with their sales rising precipitously to nearly reach parity with their console counterparts in 2004 before surpassing the latter from 2005 onwards. Henceforth, as online games gained considerable ground, they ended the period logging roughly 9 billion dollars – a remarkable tenfold increase, approximately. Notably, this sales revenue also amounted to half that of handheld games. Lastly, not until 2002 did the market begin to witness the appearance of mobile games. Interestingly, mobile-based gaming options closely tracked the trajectory of their online counterparts; yet, their upward momentum was comparatively subdued, with figures ending the period at around 7 billion dollars – the third position overall.
Vocabulary
| sheer dominance | sự thống trị tuyệt đối |
| gained traction | được chú ý/được ưa chuộng |
| stark opposition | sự đối lập rõ rệt |
| dwindled substantially | giảm đáng kể |
| shared upward momentum | cùng xu hướng tăng trưởng |
| gained significant ground | đạt được vị thế đáng kể |
| second highest-grossing types | loại có doanh thu cao thứ hai |
| contrasting pattern | mô hình đối lập |
| market offerings | sản phẩm trên thị trường |
| recreational options | lựa chọn giải trí |
| climbed steadily | tăng đều đặn |
| plateauing | chững lại |
| levelling-off | ổn định/tạm ngừng tăng |
| surged to peak | tăng vọt đạt đỉnh |
| culminating the timeline | kết thúc giai đoạn |
| solidifying its dominant position | củng cố vị thế thống trị |
| gradual downfall | sự suy giảm từ từ |
| twofold decline | giảm gấp đôi |
| proportional terms | xét theo tỷ lệ |
| gaming landscape | bức tranh ngành game |
| negligible numerical sales amount | doanh số không đáng kể |
| gather momentum | lấy đà/phát triển mạnh |
| gained widespread traction | được phổ biến rộng rãi |
| precipitously | tăng nhanh chóng |
| parity with | ngang bằng với |
| remarkable tenfold increase | tăng gấp mười lần đáng chú ý |
| sales revenue | doanh thu bán hàng |
| appearance of mobile games | sự xuất hiện của trò chơi di động |
| tracked the trajectory | theo sát quỹ đạo |
| third position overall | vị trí thứ ba tổng thể |