

Sample Answer
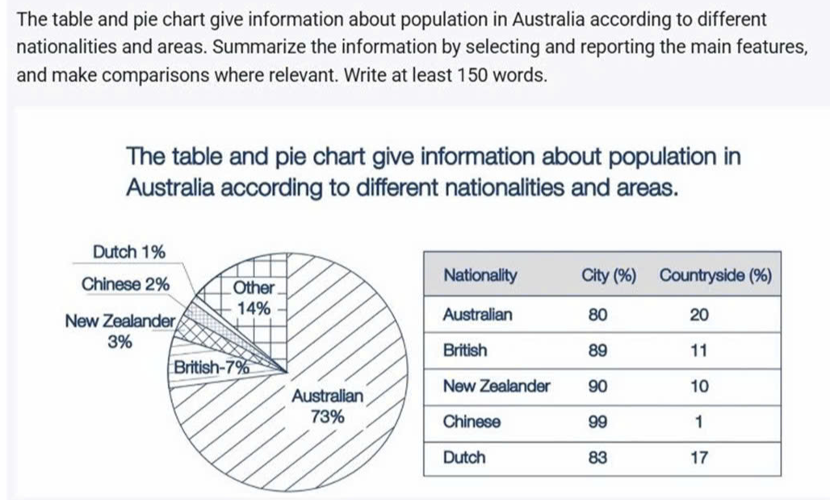
The provided table illustrates Australia’s population distribution based on nationality, while the table demonstrates where these nationalities were concentrated, either in urban or rural areas.
What is immediately striking upon observing the data is the overwhelming dominance of Australian-born citizens, which stood in stark opposition to other unspecified nationals, whereas the remaining nationalities accounted for merely single-digit shares. Equally noteworthy is the overarching predominance of urbanites across all nationalities, with the countryside appealing most highly to natives, while almost all Chinese citizens chose to reside in urban centres.
Regarding Australia’s demographic distribution, native-born residents commanded the lion’s share, standing conspicuously at nearly three-quarters of all Australia-based citizens. This representation was nearly fivefold the corresponding number for ‘other’ nationalities, which occupied a mere 14%. Notwithstanding a comparatively modest share, the presence of other unspecified nationalities in Australia was double that of British, which accounted for 7% of all surveyed respondents. The remaining nationals, conversely, consisted of single-digit percentages that were less than 5%. A proportional breakdown details that New Zealanders made up 3% of the population, equivalent to the combined share of Chinese (2%) and Dutch (1%).
Shifting attention to population allocation by area, a pattern of urbanisation was readily apparent. Chinese stood out conspicuously, with 99% of them opting for metropolitan hubs, leaving aside a negligible 1% in rural communities. At the other end of the spectrum, Australians displayed the highest share of rural residents, which accounted for one-fifth of the total native population; therefore, 80% of the population chose to live in cities. British and New Zealanders, meanwhile, followed broadly analogous trends, sharing comparable proportions of rural residents (around 10%), meaning that approximately 90% of these nationals opted to live in cities. Last but not least, Dutch belonged to the mid-tier range, with 17% of residents residing in the countryside, leaving 83% in urban areas.
Vocabulary
| overwhelming dominance | sự thống trị áp đảo |
| stark opposition | sự đối lập rõ rệt |
| accounted for | chiếm |
| overarching predominance | sự vượt trội bao trùm |
| appealing most highly | hấp dẫn nhất |
| reside in urban centres | cư trú ở trung tâm đô thị |
| commanded the lion’s share | chiếm phần lớn nhất |
| fivefold the corresponding number | gấp năm lần con số tương ứng |
| occupied a mere | chỉ chiếm |
| Notwithstanding a comparatively modest share | mặc dù tỷ lệ tương đối khiêm tốn |
| consisted of single-digit percentages | gồm tỷ lệ phần trăm một chữ số |
| proportional breakdown | sự phân tích theo tỷ lệ |
| made up | tạo thành/chiếm |
| combined share | tỷ lệ kết hợp |
| pattern of urbanisation | mô hình đô thị hóa |
| opting for metropolitan hubs | lựa chọn trung tâm đô thị |
| negligible | không đáng kể |
| highest share of rural residents | tỷ lệ cư dân nông thôn cao nhất |
| accounted for one-fifth | chiếm một phần năm |
| broadly analogous trends | xu hướng tương tự rộng rãi |
| comparable proportions | tỷ lệ tương đương |
| opted to live in cities | chọn sống ở thành phố |
| mid-tier range | mức trung bình |
| residing in the countryside | sống ở nông thôn |
| stood in stark opposition | đứng trong sự đối lập rõ rệt |